Global supply chains depend on flows of information as much as they do on flows of goods1. Digital designs for products are shared across continents. Inventories and production schedules are managed using algorithms. Payments and logistics are orchestrated through data platforms.
Why we need an International Panel on Inequality
When these data exchanges fail — because of outages, congestion or cyber incidents — the ensuing disruption propagates among suppliers and customers2. Huge economic losses can result, even if there is no physical damage.
For example, in 2024, a faulty software update from cybersecurity firm CrowdStrike crashed millions of Microsoft Windows devices and triggered a global information-technology outage. Flights, hospitals and payment systems were halted, and firms on the Fortune 500 list of the biggest US companies by revenue lost US$5.4 billion. Digital downtime costs the world’s 2,000 largest businesses $400 billion each year, according to analytics firm Oxford Economics.
Yet, information flows are not tracked systematically. Nor are they included in the core instrument used by national statistical offices to map supply chains in the economy: the monetary input–output table3. This matrix traces the value of material inputs flowing between industries, but doesn’t capture energy, data or computational resources. Similarly, firms account for what they spend on information technology, but not for the data, computation and electricity on which their operations depend.
This omission is becoming a growing problem as digital technologies, including artificial intelligence, reshape economies, and as threats to energy grids, digital connectivity and cybersecurity escalate. For instance, in April 2025, a massive electricity blackout across Spain and Portugal that took half a day to fix cut Internet traffic to 17% of normal levels and froze electronic payments, at a cost of €1.6 billion (US$1.8 billion). Around one dozen subsea telecommunications and power cables in the Baltic Sea have been damaged in suspected sabotage incidents since late 2023.
Here I set out how firms and nations can build a practical statistical tool to track essential digital data.
How information feeds growth
Energy, computation and information flows are intertwined (see ‘Hidden connections’). Businesses, especially those with high power requirements such as data centres, increasingly choose where to locate themselves on the basis of access to clean, cheap and reliable sources of electricity. In the United States, Microsoft signed a 20-year agreement in 2024 to restart the Three Mile Island nuclear plant in Pennsylvania to power its data centres. In China, the national East Data, West Computing programme is steering data centres towards western provinces, which are rich in renewables5.
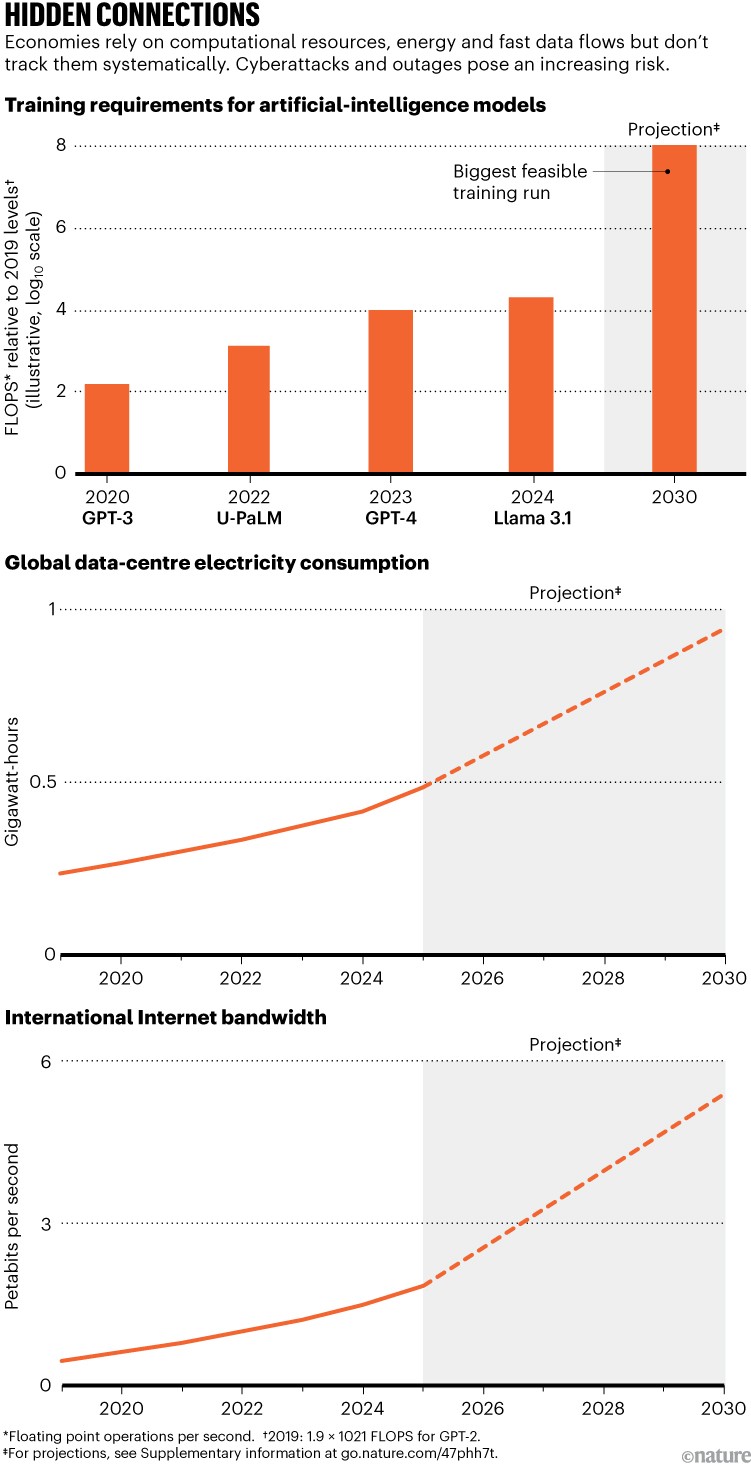
Global value chains and payment systems also need access to computational resources — such as processing power and memory — to produce, analyse and share data. The resources needed to train cutting-edge AI models have grown four- to fivefold each year for more than a decade (see go.nature.com/3tpemjh), and the largest AI-focused supercomputers now combine some 200,000 processors and draw as much power as 250,000 households (see go.nature.com/3tmh73s).
Furthermore, most economic transactions and markets are now digital. They are increasingly managed through digital tokens, which encode ownership rights, compliance requirements and how financial arrangements are to be settled.
Projections suggest that such tokens could become a major ‘commodity’ of future trade, from around $600 billion today to between $2 trillion and $9.4 trillion by 20305.

How countries can grow without impoverishing future generations
Central banks and their umbrella body, the Bank for International Settlements in Basel, Switzerland, are exploring tokenized platforms for cross-border payments, and many financial exchanges and regulators are moving towards tokenized markets for trading assets such as stocks, bonds and derivatives6.
Together, these resources reinforce one another through a feedback loop. Increasing use of AI and tokens drives demand for more computing power. Having more computing platforms and data centres raises electricity demand, which accelerates deployment of energy infrastructure and investments in the grid. All of this increases data generation, movement and storage. And value derived from the data — traded and settled using tokens — feeds back into investment in energy systems and digital infrastructure.
Thus, this chain, from watts to kilowatt-hours, floating-point operations per second (FLOPs), megabytes, tokens and dollars, captures an emerging driver behind modern growth that is not being tracked. The International Energy Agency projects that global electricity consumption by data centres could more than double from 415 terawatt-hours (TWh) in 2024 to around 945 TWh by 2030, underscoring how rapidly this loop is scaling4.
Growing risks from invisible ties
Failing to track these dependencies has real costs. And when supply chains fail, the factors that made the network brittle go unaddressed.
For instance, in March 2025, a fire at a single electricity substation shut London Heathrow Airport for a day, cancelling around 1,300 flights and disrupting travel for more than 200,000 passengers. The official review found that a transformer fault, which was known since 2018, had gone unaddressed — and that the energy networks were unaware of the airport’s dependence on that single supply point7. No accounting framework linked the substation to the airport and the supply chains downstream; the dependency became visible only when it failed.
Likewise, when a cyberattack halted production at the UK carmaker Jaguar Land Rover for five weeks in 2025, the damage — estimated at £1.9 billion (US$2.5 billion), making it the costliest cyber event in UK history — spread to more than 5,000 firms in the supply chain. No statistical instrument had recorded their dependence on a single manufacturer’s digital systems.
The chain of energy–data–computation interconnections is crucial for resilience because it represents constraints, not correlations. Conventional accounting can track who pays whom, but cannot trace where the physical and operational bottlenecks sit, how they shift over time or how a constraint in one layer (grid congestion, data-centre capacity, network disruption, transaction frictions) propagates into production losses elsewhere.
The difficulty is how to measure and assess these factors in a way that is consistent, comparable across countries and auditable by statistical offices, rather than being left to proprietary corporate dashboards.
Current statistical systems can describe the value of digital activity, but they do not yet provide a coherent way to quantify and attribute the throughput that determines supply-chain resilience. That is: the volume of computational resources supplied and used, the amount of data generated and transferred, how those flows propagate across domestic and cross-border production networks, and how they interact with electricity constraints and difficulties in settling transactions.
Since 2018, national accounting methodologies have taken a step towards making the digital economy visible, with the addition of a tool that was developed by the Organisation for Economic Co-operation and Development (OECD) in Paris. Digital supply–use tables track the production of, trade in and consumption of digital goods, services and transactions. Canada and Australia published their first such estimates in 2019; the OECD released a handbook on their compilation in 20238; and the 2025 revision of the United Nations System of National Accounts includes a dedicated chapter on digitalization. But these tables remain based on economic values, not physical constraints.

How to measure a good life — tips for moving beyond GDP
In a fast-moving economy, it’s not monetary value that changes first, but technical quantities such as data-centre efficiency, what data and energy are used for, and the relationship between computation and data flows. These quantities have macroeconomic consequences. The International Monetary Fund estimates that AI-driven demand could raise US power prices by 8.6% if renewables cannot keep pace9. Measuring them exposes vulnerabilities — such as dependence on a single data centre, cable or settlement channel — and identifies successes worth replicating.
What’s needed is a more comprehensive instrument that would allow analysts to trace computation, network traffic and settlement exposure back to the sectors and demands that drive them10, creating a basis for targeted interventions. With such a map, resilience spending can go where the dependencies are deepest, rather than falling back on blanket measures11. Governments or companies might prioritize reinforcing a facility on which many crucial sectors rely, fast-tracking grid connections in computation-constrained regions or opening alternative payment-settlement channels if one goes down.
Such a tool must be practical — something that a national statistical office can compile, audit and update, rather than a one-off research data set. It should be built on the backbone of existing systems by adding a small number of layers that make information dependencies observable in the same accounting logic.
There are precedents in other areas. When tracking water, energy and carbon became a binding requirement for businesses and economies, supply-chain tracking systems added the appropriate extensions while remaining consistent with those for measuring gross domestic product.
However, each of those extensions tracked its resource as a separate input to production.
Enjoying our latest content?
Log in or create an account to continue
- Access the most recent journalism from Nature's award-winning team
- Explore the latest features & opinion covering groundbreaking research