Renewables easily cover changes in US demand, which is rising by 2% in 2026.
Normally, we try to update you quarterly on what’s going on with the US electric grid since it provides a nice view of developing trends and smooths out some month-to-month randomness. Unfortunately, I was out of the office when last month’s data was released, so this will be a seven-month update on 2026 trends.
The top line item is that energy use is continuing to rise, albeit not as quickly as headlines about data centers might lead people to believe. Beyond data centers, there’s a growing electrification—things like EVs and heat pumps—that is shifting energy demands onto the grid. Despite all of this, electricity use has risen by only 2 percent compared to the same period last year. At this time the previous year, demand had risen by 3 percent compared to the year prior.
Some of this may be due to continued improvements in efficiency, which had largely kept electricity demand stable throughout the early 2000s. And some of it may be because more data centers are generating their own power so that demand doesn’t show up on the grid. So far, the growth in demand hasn’t reached apocalyptic levels.
Slowing solar
The other big story in recent years has been the explosive growth of solar power. The astonishing growth rates we’ve been seeing—over 30 percent year over year in many quarters—would inevitably come to an end as the ever-larger installed base would cause an identical increase to register as a smaller percentage change. But for the first seven months of 2026, there’s a smaller increase in generation.
Through September 2026, solar generated 48 terawatt-hours more than it had the year before. For the same period in 2025, that number was 39 TWh. That’s still good for a growth rate of 22 percent, but it’s a considerable drop-off at a time when demand is growing, and solar is the cheapest way to meet it. Obviously, the federal government is currently hostile to renewables and has removed incentives for their use, which may be slowing down solar’s previously astonishing expansion.
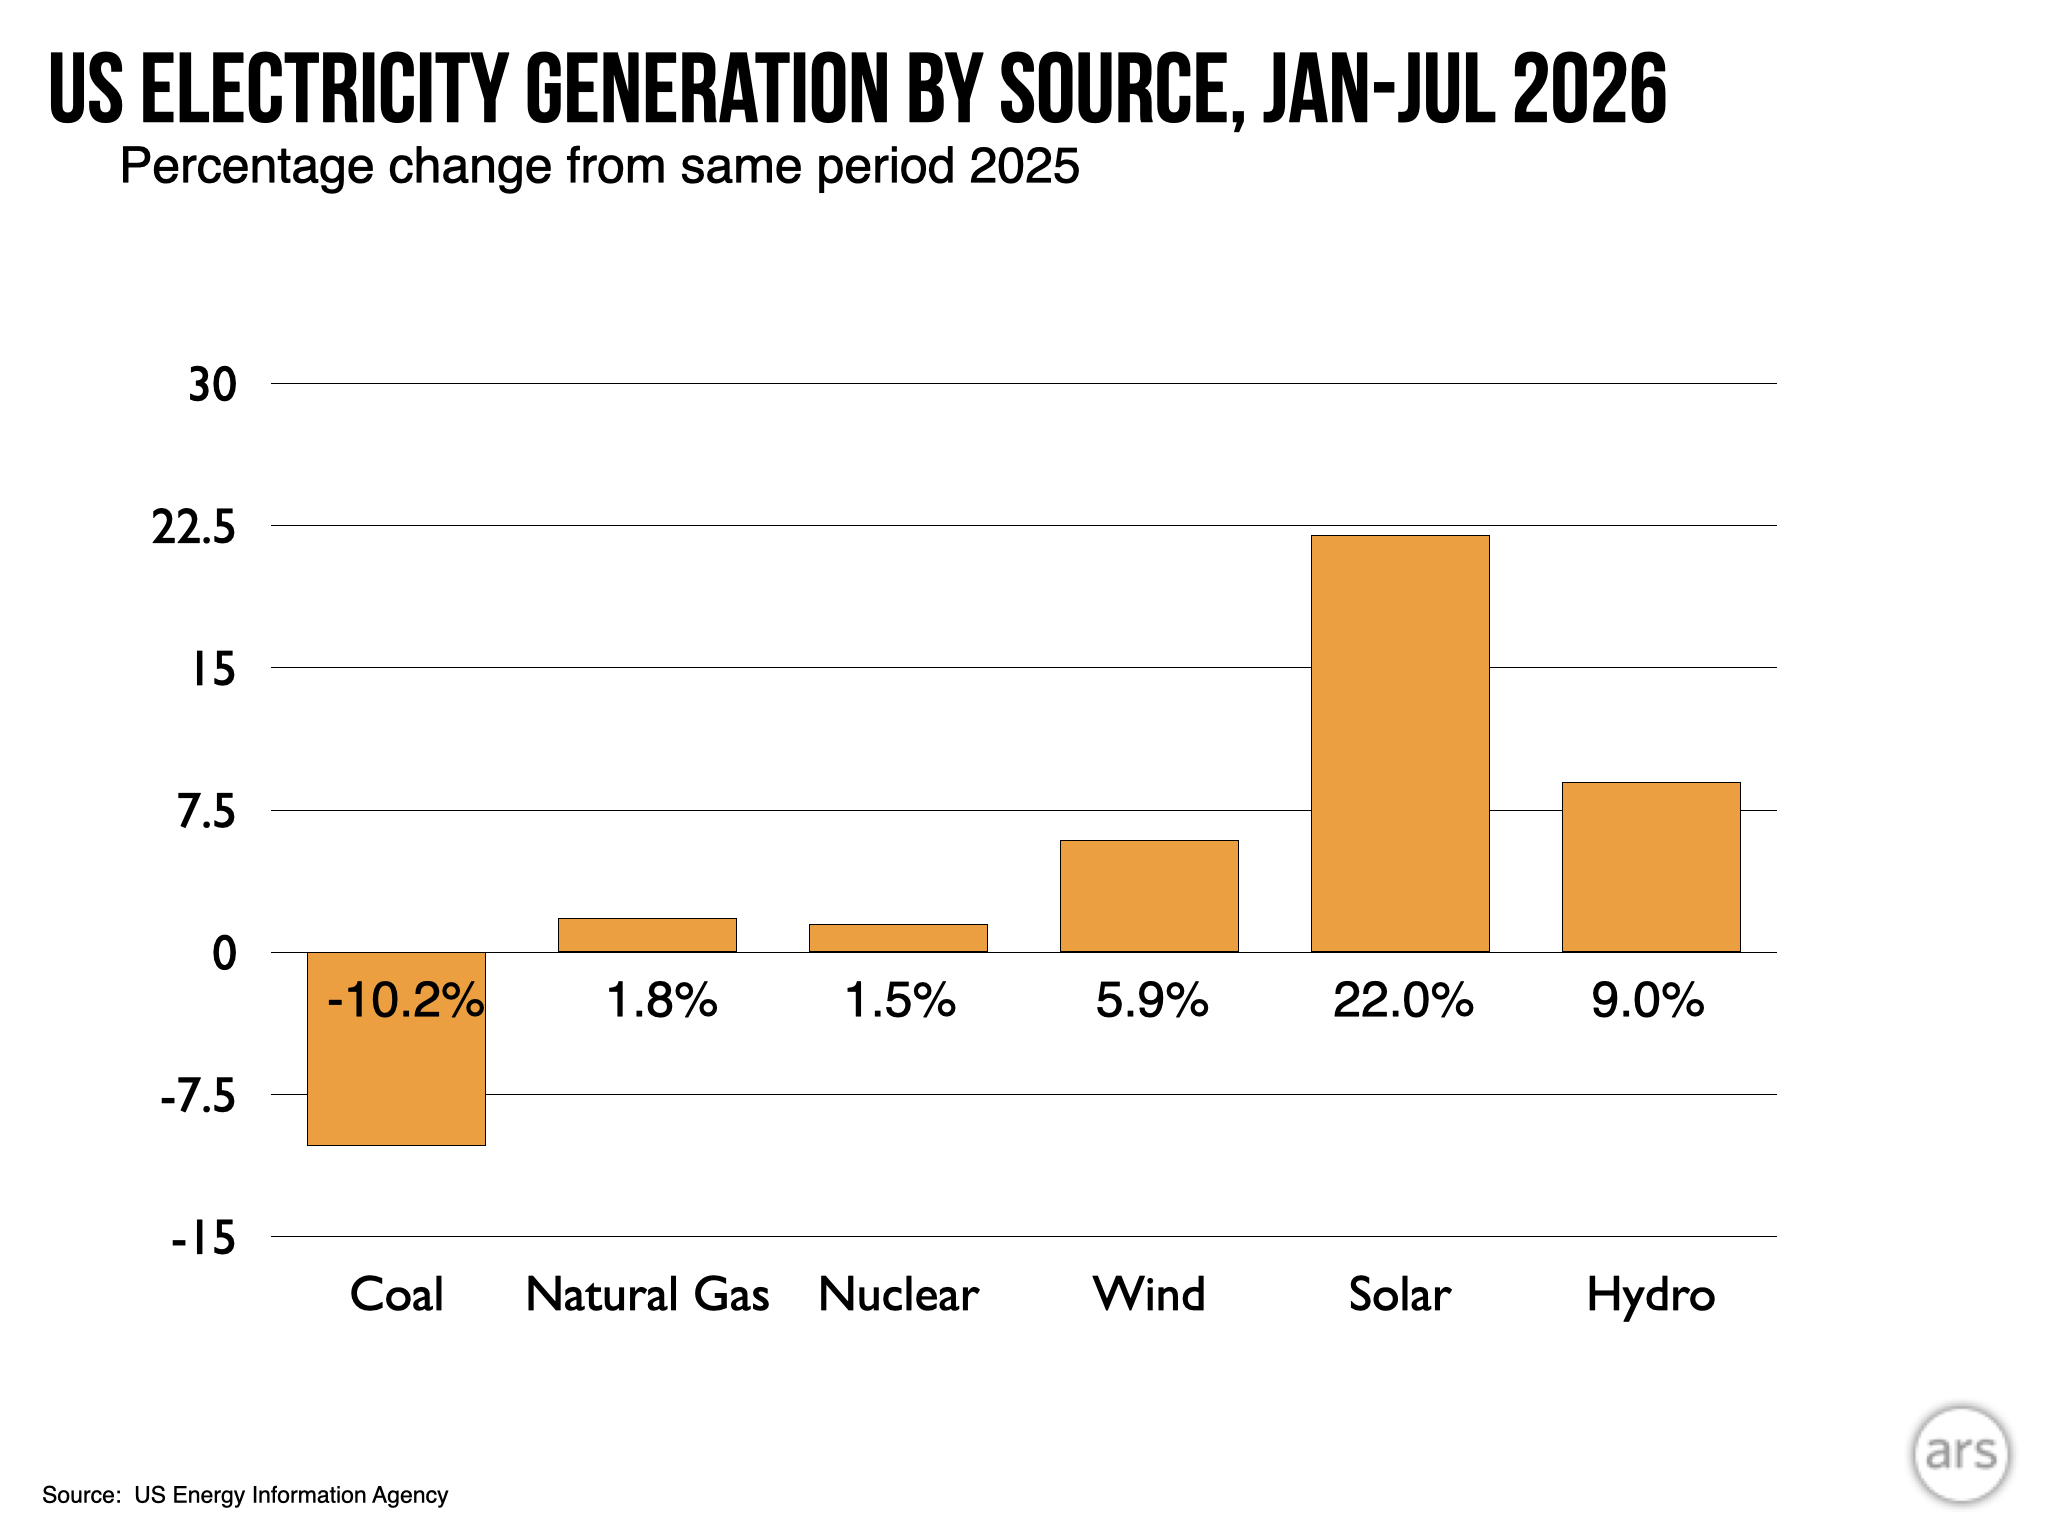
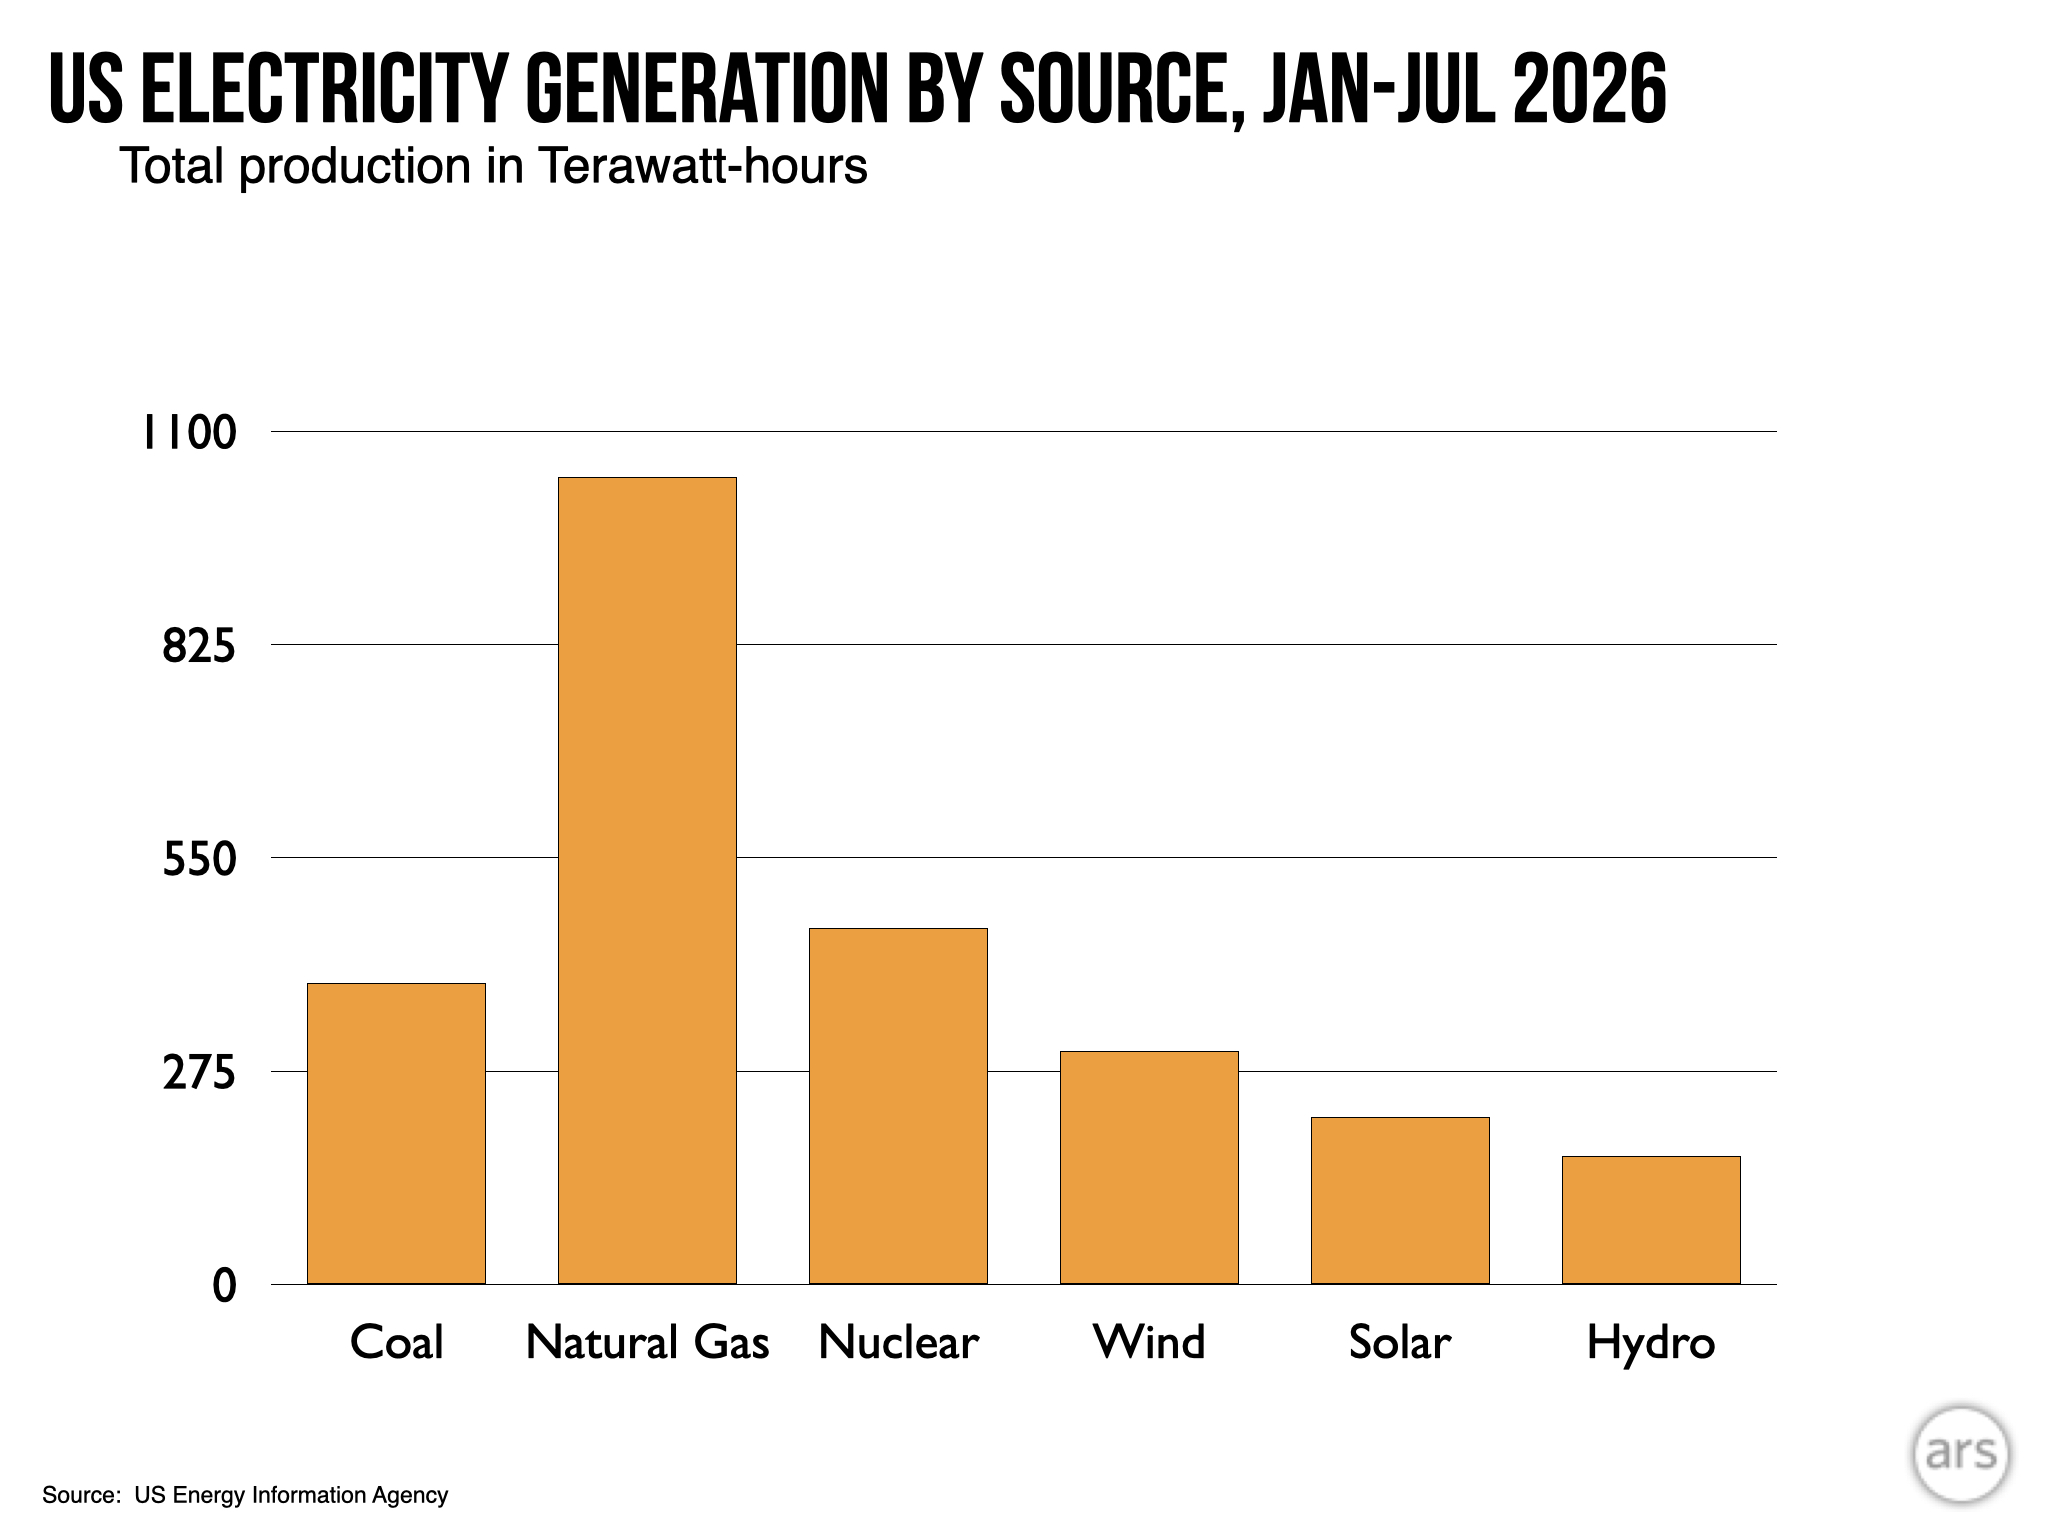
Small-scale solar, such as rooftop installations, has been growing at a slower rate, but still managed to increase by over 12 percent year over year. Combined with utility-scale generation, solar produced 72 percent as much electricity as coal over the first seven months of 2026, aided in part by coal declining by a bit over 10 percent from the same period the year before.
Beyond solar and coal, all the changes in major electricity sources were less than 10 percent year over year. Hydro is up by 9 percent, wind by 6 percent, and nuclear and natural gas both by less than 2 percent.
Overall, this leaves us with wind and solar now covering 21 percent of US electricity demand. Through the first seven months of 2026, the growth from these two sources alone was 55 Tw-hr, while demand on the grid rose by 51 TWh. In other words, their growth meant that increased use of electricity could be met entirely by renewable sources. (Again, excluding any on-site generation by data centers and the growth in small-scale solar, neither of which shows up on the grid.)
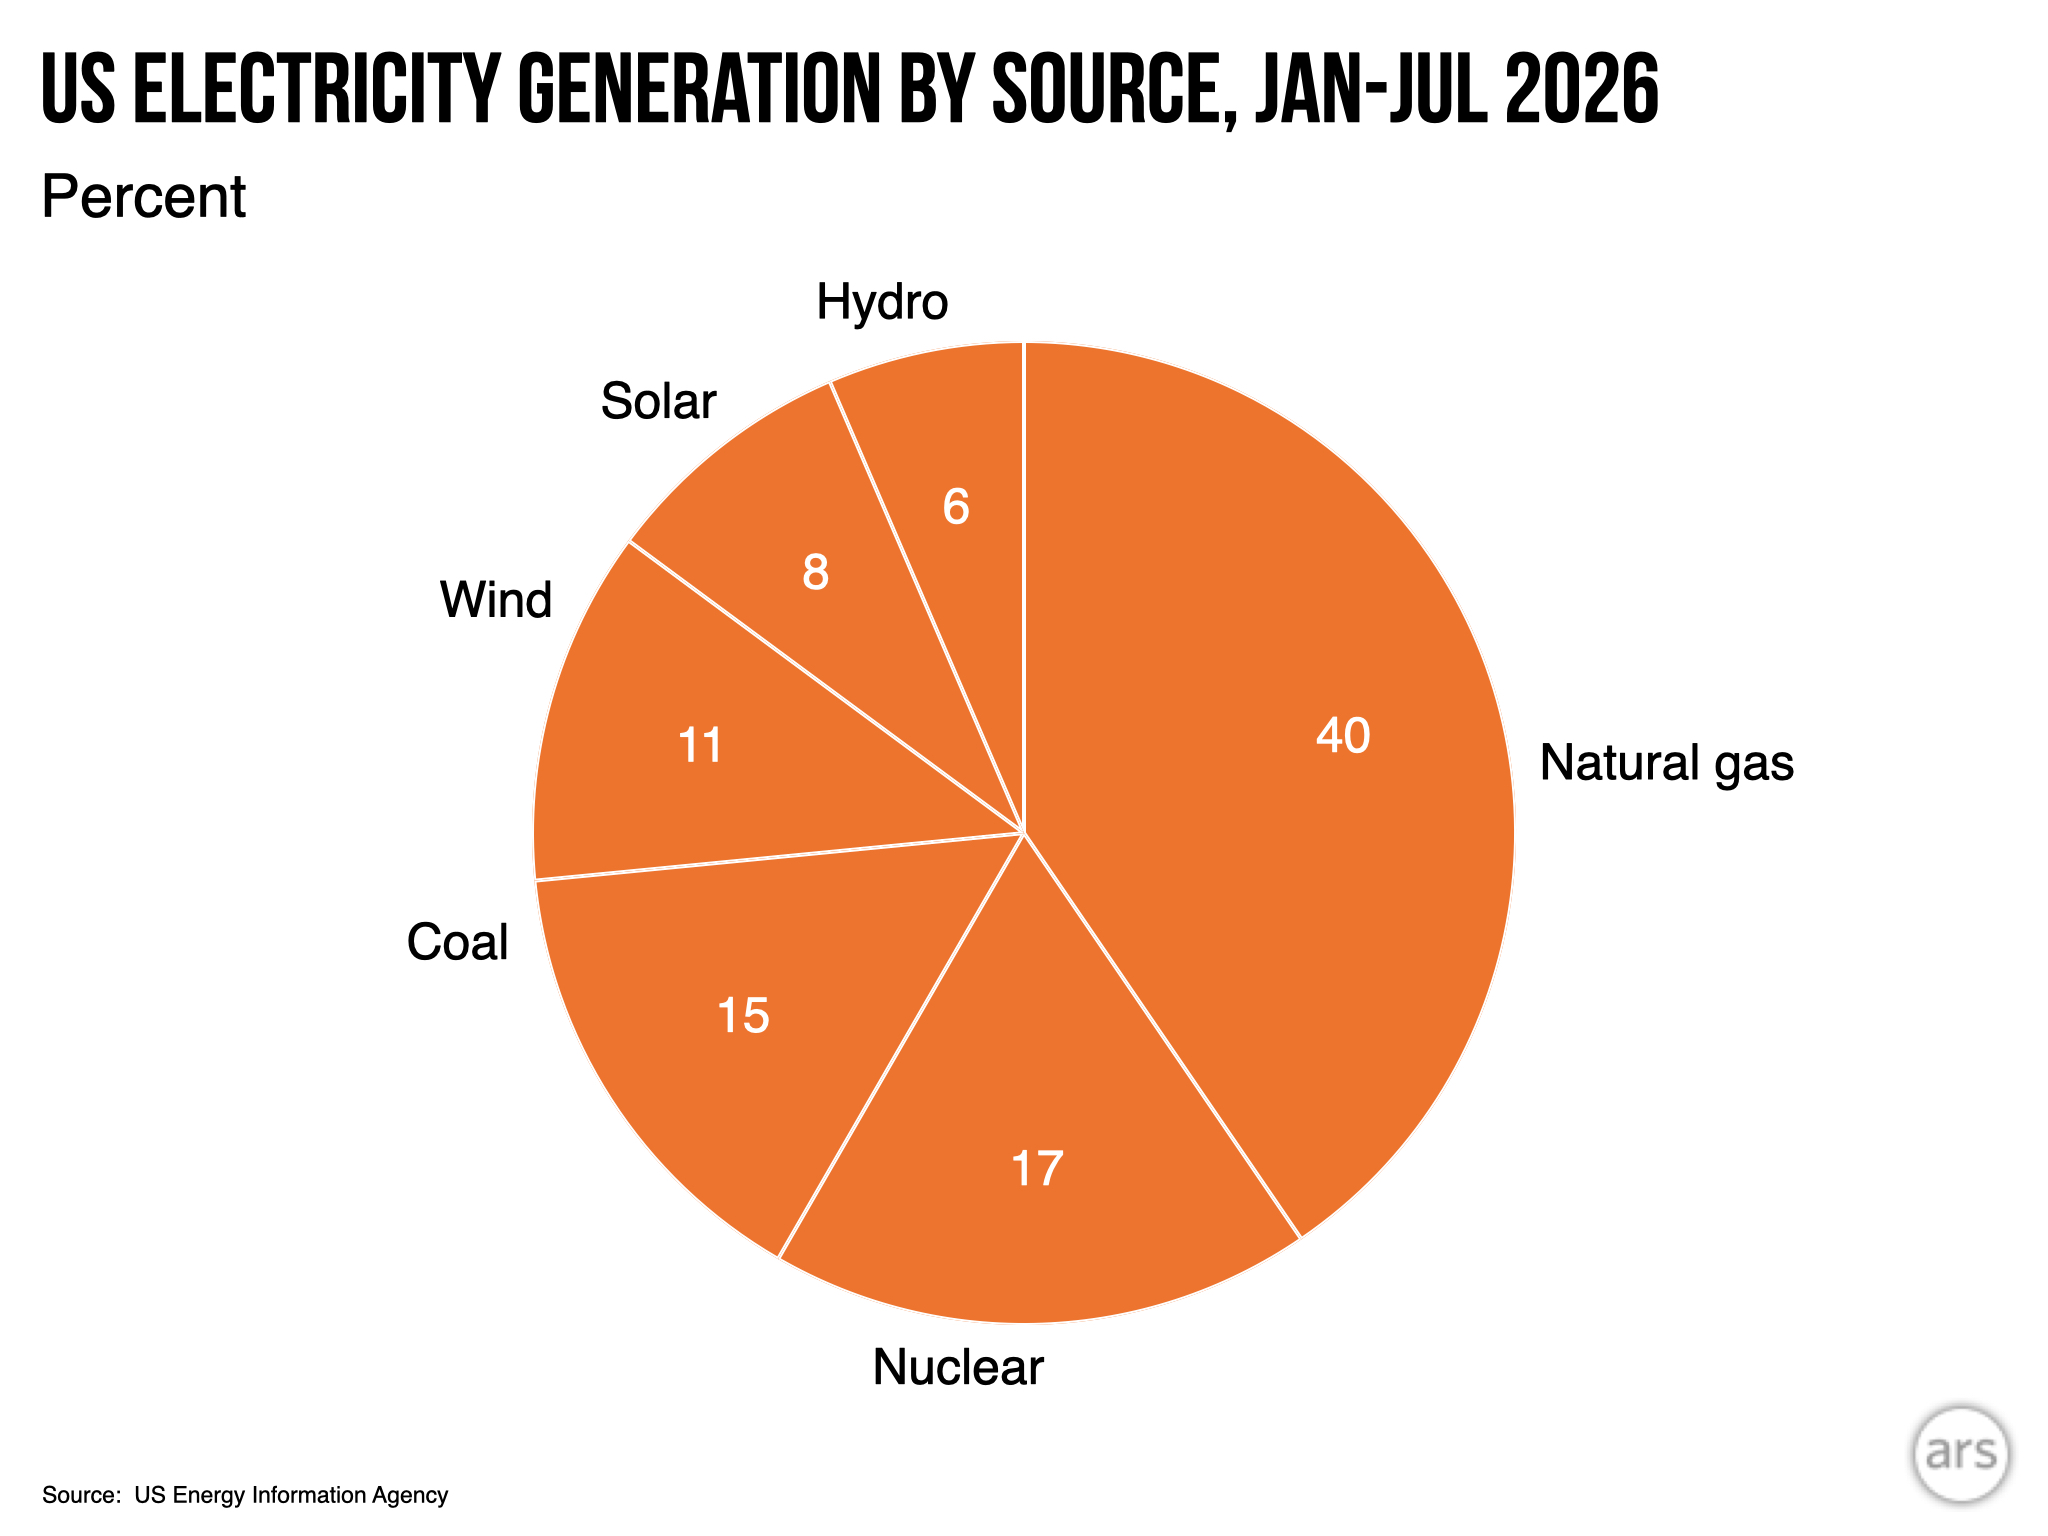
Adding in hydro means that renewables now cover 27 percent of demand. With nuclear, that adds up to the US covering 45 percent of its electricity use with non-carbon-emitting sources. For comparison, the EU generates about 30 percent of its electricity using wind and solar, and 65 percent is emissions-free. (That rises to 71 percent if you count bioenergy, which is largely carbon-neutral, but not emissions-free.)
What’s next?
The Energy Information Agency, which provides all the grid data, also keeps track of what they expect to be hooked up to the grid over the coming months, which provides some perspective on what we might expect to see over the next year. The latest version of this highlights a couple of trends and one almost-trend.
The almost comes in the form of two large offshore wind projects that will be completed off the East Coast, including a 2.6 GW monster off Virginia. The Trump administration has paid off developers to stop building anything similar, so these will likely be the last of their kind until the 2030s. Onshore wind development has continued throughout the Midwest and Plains regions.
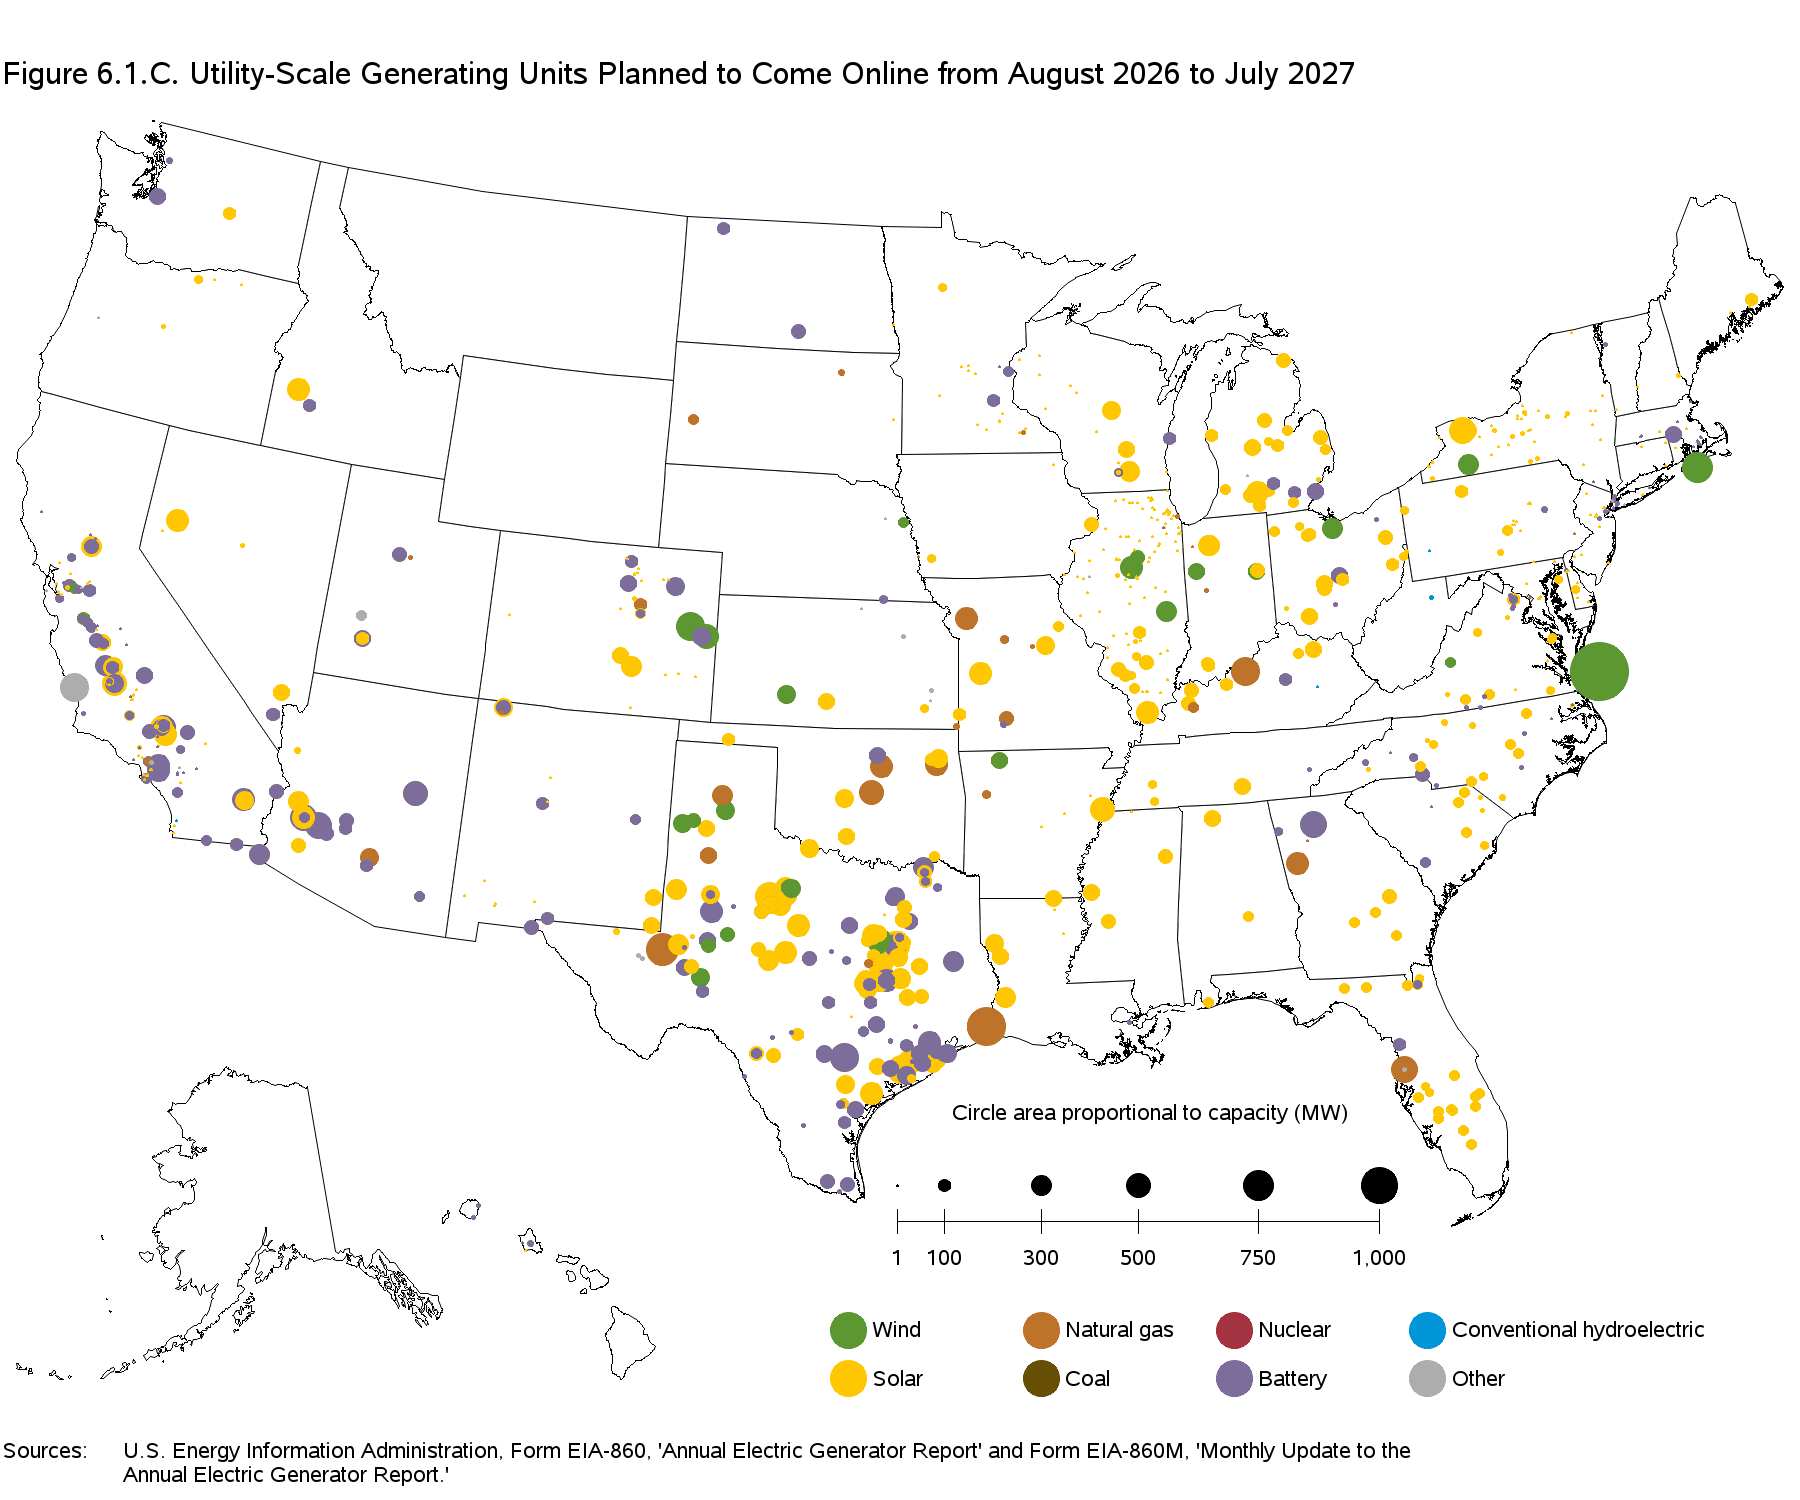
Those areas, along with the South, are also seeing a lot of solar development. This includes some significant facilities in Michigan and Wisconsin, which were probably too far north for the economics to have worked out just a few years back. Another notable change is that battery installations are starting to spread beyond the hotbeds in California and Texas. Arizona and Colorado are seeing a number of grid battery installs; the new solar in Michigan will be paired with a few, and there’s a large one expected to come online in Georgia.
A smattering of new natural gas plants will be coming online, mostly throughout the Midwest and Texas. No new nuclear or coal plants will be completed; it has now been 13 years since the last new coal plant came online in the US, and none are currently being developed.