Optical atomic frequency references1 have far surpassed their microwave frequency predecessors, leading to an anticipated redefinition of the SI (International System of Units) second2. However, as the scientific community seeks consensus on a new standard, and several state-of-the-art optical standards now report evaluated fractional uncertainties below 10−18, verification by same-species comparisons to comparable levels remains an outstanding challenge. Here we report two 176Lu+ single-ion optical frequency references, each with evaluated fractional frequency uncertainty near 1 × 10⁻¹⁹, which are directly compared by correlation spectroscopy and demonstrate agreement, with a measured relative frequency difference of [−0.1 ± (5.7)stat ± (1.0)sys] × 10−19, where ‘stat’ and ‘sys’ indicate the statistical and systematic uncertainty, respectively. Our optical references have been comprehensively assessed with evaluated uncertainties below 10−18, supported by a same-species comparison of independent systems to the 5.7 × 10⁻¹⁹ level. This accuracy, achieved in practical room-temperature systems, will contribute to improving international timekeeping and towards chronometric levelling3,4 at the millimetre scale, as well as tests of fundamental physics5 such as Lorentz invariance6, general relativity7, searches for dark matter8,9 and variation of fundamental constants10,11.
Explore related subjects
Discover the latest articles and news in related subjects.As the international scientific community seeks consensus on a new standard for redefinition of the SI (International System of Units) second (ref. 2), it is essential that the uncertainty budgets of optical standards are both rigorously evaluated and experimentally tested through comparison. Although several state-of-the-art optical standards now report evaluated fractional uncertainties below 10−18 (refs. 12,13,14), same-species comparisons to experimentally test these claims are relatively few6,7,15,16. Meanwhile, inter-species comparisons at the highest precision have shown significant inconsistencies relative to reported uncertainty budgets17,18,19,20. An evaluated uncertainty budget is a quantitatively testable prediction that two frequency standards of the same species, corrected for their evaluated systematic shifts, should agree to within their combined uncertainties. In this work, we test that prediction directly by adhering to three criteria for a rigorous assessment of our optical frequency standard21: (1) a clear set of experimental measurements of atomic properties and environmental factors determining the systematic uncertainty budget; (2) a same-species comparison to demonstrate validity of the uncertainty budget to the degree the measurement precision allows; and (3) a stress test on any systematic that is substantially larger than the measurement precision of the comparison, that is, a frequency comparison in which the systematic is deliberately shifted and observed to give the predicted shift in the clock frequency. Applying these criteria, we report one of the first comprehensive characterization of all known sources of systematic uncertainty for two independent 176Lu+ single-ion optical references, each with evaluated systematic uncertainty near 1 × 10⁻¹⁹, a fourfold improvement on the lowest previously reported12,14. Their agreement is verified at the level of 5.7 × 10⁻¹⁹, limited by the comparison precision, after 200 h of averaging.
The exceptionally low systematic uncertainty is possible because of the relative insensitivity of the 176Lu+1S0 ↔ 3D1 transition to perturbations compared with other leading contenders. In particular, this transition has the lowest sensitivity to blackbody radiation (BBR) and magnetic fields of any established clock system, and the large atomic mass makes it less susceptible to motional shifts than lighter atomic species. The complete uncertainty assessment, summarized in Table 1, builds on several recent advances, including an improved method for micromotion compensation22, evaluation of the quadrupole shift by 176Lu+ microwave spectroscopy23 and evaluation of background gas collision effects24.
Frequency comparison at these extreme levels of precision on practical timescales requires exceptionally high stability, a figure of merit for which single trapped ion optical standards have historically lagged relative to neutral-atom optical lattice clocks25,26,27,28. In this work, we use correlation spectroscopy29,30,31, which rejects common-mode phase noise from a shared clock laser and enables interrogation times limited only by the atoms. The measured agreement therefore characterizes the atomic references themselves, independent of the performance of any particular clock laser. Here, we demonstrate interrogation times up to 10 s and a comparison measurement instability of 4.8 × 10⁻¹⁶ (τ/s)−1/2, nearly a factor of 3 improvement over previous work16 and within a factor of three of the best reported ratio measurement instabilities involving an ionic frequency standard realized by correlation spectroscopy31, differential spectroscopy32 or clock comparisons18 with state-of-the-art laser stabilization33.
For 176Lu+, a same-species comparison of independent systems provides exceptionally strong verification because all evaluated systematic effects—except for the readily controlled quadratic Zeeman shift—are small compared with the statistical measurement precision. Consequently, even if these known effects were perfectly common mode, they could not mask an error larger than the statistical uncertainty. To undermine the validity of the claimed performance, a hypothetical systematic shift would have to be both of unknown physical origin and common mode across the two independent experimental setups.
Experimental system
All optical clock systems use some form of averaging, in which the frequencies of two or more transitions are combined such that the average frequency is insensitive to perturbations from external fields. Most commonly, this is an average over one or more pairs of Zeeman lines, which cancels the linear Zeeman shift34. In the case of 176Lu+, we use averaging over the transitions from to for F = 6, 7 and 8 at the optical frequencies fF. Conceptually, this hyperfine averaging technique35 leads to an effective J = 0 level for which the quadratic Zeeman and quadrupole shifts of the (J = 1) states are largely eliminated in the hyperfine average (HA) frequency, . Rather than sequentially interrogate multiple optical transitions, the average can be conveniently realized by Ramsey spectroscopy on a single optical transition by using a hybrid microwave and optical pulse sequence16,36. As shown in Fig. 1b,c, the interrogation sequence consists of a Ramsey interrogation on the |g⟩ to |8⟩ transition and microwave transitions within the interrogation time to transfer population between the hyperfine states. Timing is such that the effective time in each of the hyperfine states is the same. Steering the laser to the central Ramsey fringe ensures the linear combination is the HA frequency f. This interrogation scheme has several advantages: exclusive use of first-order field-insensitive m = 0 magnetic substates, the HA is realized every interrogation cycle, and it is readily extended to incorporate the hyper-Ramsey (HR)37,38 technique for suppression of the laser-induced a.c. Stark shift by inclusion of an additional phase-shifted optical π pulse. The timing, pulse areas and phases of the full hyperfine-average–hyper-Ramsey (HA–HR) sequence used in this work are shown in Fig. 1d with further details given in the Methods.
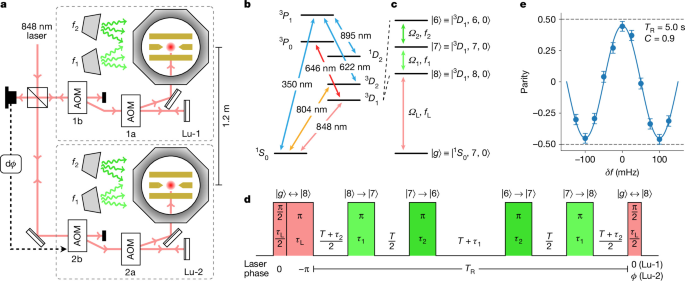
a, Simplified experimental scheme for correlation spectroscopy used to compare Lu-1 and Lu-2. Acousto-optic modulators (AOMs) labelled 1a and 2a control the intensity, frequency and relative phase of clock laser pulses delivered to the respective trapped ions, whereas AOM 2b actively compensates for differential path length fluctuations referenced to retroreflecting mirrors near the viewports of the respective vacuum chambers. Microwaves are delivered by horns external to the vacuum chambers. b, Atomic-level structure of 176Lu+ showing the wavelengths of transitions used. c, The 848-nm optical clock transition and 3D1 microwave clock transitions addressed in the clock interrogation sequence. Ωα and fα denote the coupling strengths and frequencies for the fields driving the indicated transitions, respectively. d, Clock interrogation sequence for hyperfine-averaged HR spectroscopy. e, Parity signal observed for a scan of the optical frequency difference with a Ramsey time TR = 5 s. Each point represents the mean of 400 measurements, with error bars given by quantum projection noise.
We compare single 176Lu+ ions in two independent ion traps, Lu-1 and Lu-2, using correlation spectroscopy29,30, which enables comparison of the references at high stability limited only by the differential atomic coherence rather than the laser coherence31. The experimental setup is shown schematically in Fig. 1a and is similar to that described in previous work16. After initialization of both ions in the |g⟩ state, the ions are simultaneously interrogated with the HA–HR sequence followed by detection of population in the 3D1 state. For total Ramsey time TR much longer than the laser coherence time, the expectation value of the parity, Π, is given by31
where δf ≡ f(1) − f(2) is the difference in the HA-equivalent linear combination of laser and microwave field frequencies used within the interrogation sequence for Lu-k, ϕ is a phase step applied only to the final optical π/2 pulse for Lu-2, and is the parity fringe contrast. A typical frequency scan demonstrating minimal loss of parity fringe contrast for a Ramsey time TR = 5 s is shown in Fig. 1e.
At the typical operating magnetic field of B0 = 0.1 mT in both experiment chambers, we observe the contrast loss as a function of interrogation time shown in Fig. 2a. In contrast to previous work16, we are no longer limited by thermal dephasing due to ion heating: the dashed line in Fig. 2a represents the simulated contrast loss due to thermal effects as evaluated for the current system. Although the HA frequency is extremely insensitive to magnetic fields, the individual component transitions are weakly susceptible to magnetic fields through the quadratic Zeeman shifts of the states, for which the |6⟩ and |8⟩ states have linear magnetic sensitivities of about ±4 kHz mT−2B0 ~±400 Hz mT−1. Independent measurements on magnetic sensitive states indicate the ambient magnetic field has flicker instability of 7 nT on the timescales of interest for clock interrogation (about 1−100 s). The observed loss of contrast is consistent with simulations of uncorrelated magnetic-field noise at this level for each ion, shown in Fig. 2a (solid line). Coherence times on the microwave transitions of individual systems, their dependence on the d.c. magnetic field and the observed contrast for HA–HR correlation spectroscopy are all consistent with uncorrelated magnetic field noise at this level.
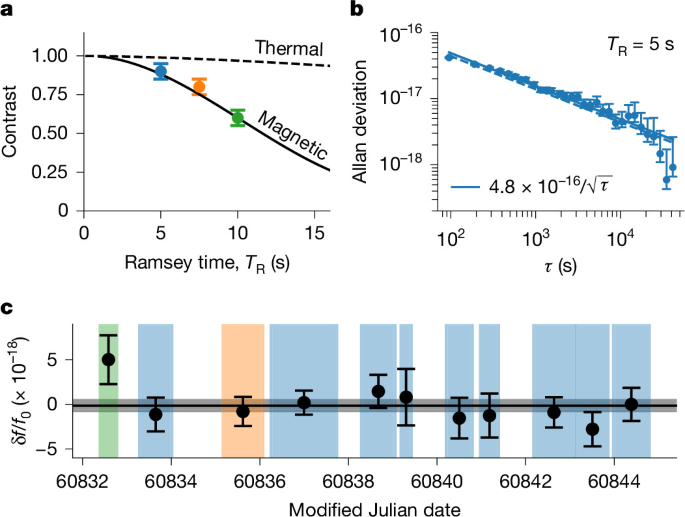
a, Parity contrast inferred from the servo instability (points) compared with the simulated contrast loss due to ion heating (dashed black line) and due to uncorrelated 7 nT magnetic field flicker noise in both chambers (solid black line). b, Allan deviation for the longest continuous measurement with TR = 5 s. The dashed line is the projection noise limit for full parity contrast (C = 1) and the solid line is observed instability 4.8 × 10⁻¹⁶ (τ/s)−1/2 corresponding to C = 0.9. c, Frequency difference (black points) from 11 measurements with a combined duration of 8.3 days over a 12.4-day interval (67% uptime). Error bars represent the statistical uncertainties that are assumed to be projection noise limited. The shaded vertical bars show the measurement intervals, with the colour indicating Ramsey time for TR = 5 s (blue), 7.5 s (orange) and 10 s (green). The weighted mean frequency difference is [−0.1 ± (5.7)stat ± (1.0)sys] × 10−19 with reduced chi-squared \({\chi }_{\nu }^{2}=0.75\) for 10 degrees of freedom.
The results of 11 comparison measurements totalling 200 h are shown in Fig. 2c. With the exception of two initial measurements taken with Ramsey times of 7.5 s and 10 s, a Ramsey time of TR = 5 s was used. In all cases, the observed instability is consistent with the quantum projection noise limit after accounting for the fringe contrast. Figure 2b shows the Allan deviation of the longest continuous run (37 hours, TR = 5 s), demonstrating an instability of 4.8 × 10⁻¹⁶ (τ/s)−1/2. The weighted mean frequency difference of all 11 measurements is [−0.1 ± (5.7)stat ± (1.0)sys]× 10−19.
We evaluate a total systematic uncertainty of 1.2 × 10⁻¹⁹ for Lu-1, 1.3 × 10⁻¹⁹ for Lu-2 and 1.0 × 10⁻¹⁹ for the difference, with individual contributions summarized in Table 1. The only systematic shifts with magnitude larger than 10−18 are the quadratic Zeeman shift and the BBR shift, which is a testament to the insensitivity of 176Lu+ to perturbation. We proceed with a brief discussion on the evaluation of systematic effects, leaving the technical details to the Methods and Extended Data.
The quadratic Zeeman shift is, by a factor of 100, the largest systematic and the only systematic more than an order of magnitude larger than our measurement precision. It is characterized by the quadratic Zeeman coefficient for which a value of αz = −4.892 64(88) Hz mT−2 has been previously reported16. Measurement of the quadratic Zeeman coefficient constitutes a stress test of the reference in accordance with our third criterion, as it calibrates changes in the reference as a function of applied magnetic field. In the interest of scientific rigour and because it is the largest systematic shift, αz was remeasured in both the years 2024 and 2025, with both measurements being subsequent to a major lab renovation and replacement of the Lu-1 trap. The later measurement data are shown in Extended Data Fig. 1a,b. There is no statistically significant deviation from a quadratic dependence, which highlights the effectiveness of hyperfine averaging operating over a wide range of magnetic fields. The three measurements of αz are shown in Extended Data Fig. 1c. We take the weighted mean value of αz = −4.893 27(51) Hz mT−2, where the statistical uncertainty has been scaled by the square root of the reduced chi-square statistic \({\chi }_{\nu }^{2}=1.85\). It is noted that the probability \(P[{\chi }_{\nu }^{2} > 1.85]=0.16\) for two degrees of freedom and so the three measurements of αz are statistically consistent. For high-accuracy comparison at 0.1 mT, uncertainty in αz contributes 1.4 × 10⁻²⁰ uncertainty to the individual optical references, but this contribution is correlated in the comparison. The uncertainty in the difference of quadratic Zeeman shifts is determined from the magnetic field stability and is <10−21 owing to the tracking and active steering of the magnetic fields in both chambers.
The blackbody radiation shift contributes the largest systematic uncertainty for the individual clocks, at 1 × 10⁻¹⁹, which is limited by the uncertainty in the d.c. polarizability39,40. The differential BBR uncertainty is limited by the assessment of the environmental temperature, which is detailed in the Supplementary Information. Briefly, the assessment bounds the temperature between that of the ambient environment and the maximum temperature of the local environment of the ion due to radiofrequency (RF) heating of the ion trap. The contribution of RF heating is evaluated by temperature measurements on a test trap of identical construction combined with modelling and numerical simulations of the heat transfer. We estimate the temperatures T1 = 301.5(1.7) K for Lu-1 and T2 = 300.8(1.2) K for Lu-2, which capture, within 1σ uncertainty, the minimum and maximum temperature bounds. We note that it would require an increase in the upper bound temperature by 2° to change the BBR uncertainties of the individual systems even at the lowest significant digit reported, 1 × 10⁻²⁰.
Some of the shifts in Table 1 are suppressed by the use of long interrogation times: the a.c. Zeeman shift due to the microwave interrogation pulses, the a.c. Stark shift due to the 848 nm clock laser and HA timing errors due to microwave coupling uncertainties. By contrast, the second-order Doppler shift (SODS) due to thermal motion becomes more significant as the interrogation time is increased because of ion heating. Heating rates for both traps were characterized separately for radial and axial principal axes. At TR = 5 s, the SODS uncertainty is still at the low 10−20 level, but would become the largest source of uncertainty for significantly longer interrogation times.
Both the a.c. magnetic field at the RF trap frequency and the d.c. electric field gradient are characterized by auxiliary measurements on Lu+, in contrast to previous work that used Ba+ (ref. 41). The a.c. magnetic field is inferred by measuring an Autler–Townes splitting on the to transition with microwave spectroscopy. The electric field gradient is inferred from the quadrupole shift measured on the 3D1 microwave transitions, made possible by recent precision measurements of the unperturbed frequencies of the microwave clock transitions23. Systematic uncertainty in the quadrupole shift on the HA optical frequency is limited by the uncertainty in the residual quadrupole moment23,42.
At the level of accuracy and precision demonstrated in this work, the shift arising from collisions between the ion and the background gas is a potentially important systematic. We have investigated this through both a classical analysis similar to that in ref. 43 and through a quantum treatment given in ref. 44, for which we get agreement from both descriptions. We have shown24 that the shift can be bounded by the classical Langevin collision rate and a factor that characterizes the decoupling of the ion from the clock laser due to the recoil motion. Based on collision rates inferred from these decoupling measurements, we infer background pressures of 3.5 nPa and 5.8 nPa and estimate collision shift bounds of 3.9 × 10⁻²⁰ and 3.2 × 10⁻²⁰ in the respective chambers (Methods).
An ideal optical reference transition has three essential properties45: (1) a high frequency and long-lived upper state, enabling good short-term stability; (2) insensitivity to external perturbation, enabling high accuracy; and (3) practical operation with accessible laser wavelengths. The 1S0 ↔ 3D1 transition in 176Lu+ satisfies all of these criteria to a high degree simultaneously, perhaps more than any other reference. The week-long excited-state lifetime removes any practical limit to interrogation time. The cooling, repumping and clock wavelengths are all accessible with commercial solid-state and diode laser sources. The insensitivity to external perturbation has made possible the record-low evaluated uncertainty reported here, although these experiments are operated at room temperature in relatively basic linear Paul traps without magnetic shielding, which may be readily developed into transportable optical clocks46 without compromising performance. Moreover, an improved evaluation of the d.c. polarizability as proposed in ref. 47 would immediately reduce the total uncertainty of these existing systems to the level of mid-10−20, although our measurement precision must advance to take advantage of this ability. These properties in combination make 176Lu+ a compelling candidate as the international community assesses systems for the redefinition of the SI second.
Frequency comparisons are the means by which clock performance is established in practice. The international roadmap towards redefinition of the SI second2 sets two thresholds: an evaluated systematic uncertainty of ≲2 × 10⁻¹⁸ and validation through frequency comparisons between institutes demonstrating agreement to an overall uncertainty of ≲5 × 10⁻¹⁸. Between-institute comparisons at this level remain an outstanding challenge, with only a limited number of within-institute same-species comparisons having reached this threshold. Table 2 summarizes all reports, to the best of our knowledge, that meet either threshold. Looking beyond these thresholds, differential gravitational redshift between remote sites becomes an unavoidable limitation. Over long baselines, geopotential differences are presently known to no better than a few centimetres in equivalent height, corresponding to a relative frequency uncertainty ≳2 × 10⁻¹⁸ (refs. 4,48), well above both the evaluated uncertainty and the verification level of this work. Below 10−18 testing of uncertainty budgets thus requires comparison of references at the same location, with inter-institute validation at this level only possible through transportable references46. Of the standards listed in Table 2, fewer than half are accompanied by a same-species comparison, and before this work none had total uncertainty below 10−18.
Accuracy reflects reproducibility, for which we are limited in this report by the measurement precision. But reproducibility alone is insufficient if large systematics are incorrectly evaluated, which is why we have stress-tested the quadratic Zeeman shift multiple times. By contrast, the BBR shift is still too small for practical temperature differences to influence the observed agreement.
At the level of precision demonstrated here, a comparison between remote references is necessarily a direct measure of geopotential difference rather than a test of the optical references. This sensitivity resolves height differences at the millimetre scale, beyond the reach of conventional geodetic techniques3,4. Likewise, for tests of fundamental physics5, an unexplained frequency difference is evidence of new physics only if the references themselves are above suspicion. Fulfilment of this potential therefore requires rigorous, measurement-based assessment and demonstrated reproducibility of the standards. Below 10−18, lutetium stands alone in this regard.
Experimental sequence
Each interrogation beginsonly after both ions have been subjected to Doppler cooling and prepared in the |g⟩ state with >99% probability using the conditional state preparation sequence described in ref. 53. Both ions are interrogated with the HA–HR sequence shown in Fig. 1d, with the parameters τL ≈ 4 ms, τ1 = τ2 ≈ 12 ms, and a total Ramsey time given by TR = 3(T + τ1 + τ2). Comparisons of the two independent frequency references are carried out by measuring the parity alternately for and, after N interrogation cycles, steering \(\varPi \left(\frac{{\rm{\pi }}}{2}\right)-\varPi \left(-\frac{{\rm{\pi }}}{2}\right)\) to zero by updating δf. For the comparisons at the same 0.1 mT magnetic field, as is the case for all results shown in Fig. 2, the microwave drive frequencies f1 and f2 are identical for both ions and fixed throughout. For comparisons at different magnetic fields, as when evaluating the quadratic Zeeman coefficient αz, the microwave frequencies are necessarily different to compensate quadratic Zeeman shifts. The frequency difference δf is set by an acousto-optic modulator (AOM), labelled AOM 2a in Fig. 1a. Two auxiliary measurements are interleaved with the comparison servo: Rabi spectroscopy of the optical transition to ensure the 848 nm clock laser is near resonance and measurement of the Zeeman splitting for each ion using microwave spectroscopy. The Zeeman splitting is used to infer the magnetic field, and feedback is applied to shim coils to compensate for any slow field drift, with further details in the Supplementary Information. HA–HR interrogation time is typically 87% of the total duty cycle, including the auxiliary measurements.
Magnetic field stability and servo
The short-term stability of the magnetic field is shown in Extended Data Fig. 2 (blue points). This was evaluated from a separate experiment measuring a Zeeman splitting with fast servo attack time. Over the range of Ramsey times of interest in this work (about 1–50 s), the magnetic field noise shows flicker instability of approximately 7 nT. During comparison measurements, the magnetic field is steered to the set point of B0 = 0.1 mT by a compensation coil with a typical servo attack time of tser ≈ 80 s using interleaved measurements of the Zeeman splitting. The orange points in Extended Data Fig. 2 show the field instability inferred from the in-loop measurements of the Zeeman splitting, which averages down ∝(tser/τ) for reasons explained in the Supplementary Information. The true instability of the magnetic field is limited by both projection noise and deadtime , which was verified in a test run using interleaved out-of-loop measurements of the Zeeman splitting (Extended Data Fig. 2, green points). This out-of-loop stability is taken as an upper bound on the magnetic-field instability with compensation engaged. The magnetic field contributes uncertainty through the quadratic Zeeman shift of \(\frac{\delta {\nu }_{\mathrm{QZ}}}{{\nu }_{0}}=2{\alpha }_{z}{B}_{0}\delta B(\tau )\approx 2\times 1{0}^{-19}\times {(\tau /{\rm{s}})}^{-1/2}\) beyond the servo attack time.
Detection and background gas collisions
To detect background collisions as much as possible and ensure the ions are sufficiently re-cooled before the next experiment cycle, we use the detection sequence shown in Extended Data Fig. 3a at the end of every Ramsey experiment. The intervals di represent adaptive Bayesian state detection54 by 646 nm fluorescence. If the ion is detected dark in the initial detection d0 after the Ramsey sequence, which is about 50% of events, then three attempts are made to shelve on the 848 nm clock transition and detect. The variable 848 nm clock pulse areas are tailored to maximize population transfer even for higher thermally occupied vibrational n states. The probability of at least one successful shelving is >99.5% for the expected thermal distribution accounting for ion heating during the Ramsey dark time TR. If the ion is not detected bright on any of d0...3, then it is assumed that a collision has occurred with sufficient energy transfer to significantly reduce either (1) the coupling on the 848 nm transition or (2) the 646 nm fluorescence rate. During clock comparison servo operation, if a collision is detected in this way on either Lu-1 or Lu-2, that interrogation cycle is considered invalid and repeated.
If a collision is detected (d0...3 all dark), the additional ending sequence shown in Extended Data Fig. 3a is applied. First, a repump pulse (350 nm, 622 nm and 895 nm) and another detection d4 is attempted. If bright, this is attributed to a lower-energy-transfer collision of type 1: sufficient to reduce efficiency of shelving on the clock transition but not detection. If dark, then the collision is of type 2: energetic enough to disrupt detection. In either case, a cycle of cooling and fluorescence detection with a high threshold, bi, is repeated until the ion is confirmed bright to ensure the ion is effectively cooled for the next experiment cycle. Extended Data Fig. 3b shows the probability of outcomes (1) and (2) as a function of TR from which we extract rates Γ(1) and Γ(2). To estimate the detectable collision rate Γ, we assume and Γ(2) = PdΓ, where Pd is the probability a collision interferes with bright detection, resulting in outcome (2). Of the lower energy transfer collisions at rate (1 − Pd)Γ, we assume half are not detected because the ion was in 3D1 at the end of the Ramsey experiment and half are detected as outcome (1). We infer the collision rates Γ = 1.9 × 10⁻³ s−1 for Lu-1 and 5.9 × 10⁻³ s−1 for Lu-2.
After the comparison measurement campaign, additional experiments were performed to estimate the collision rate without the complications introduced by Ramsey spectroscopy. The ions were prepared in the 1S0 ground state, and after a delay of 5 s, an attempt was made to reshelve and detect using a similar sequence as shown in Extended Data Fig. 3a. From the probability that all of multiple shelving attempts on the clock transition fail, we directly infer the detectable collision rates Γ = 2.9(3) × 10−3 s−1 for Lu-1 and 6.5(6) × 10−3 s−1 for Lu-2, in reasonable agreement with the rates inferred from the measurement campaign data.
Our extensive analysis of collision shifts in ion-based optical clocks is given in ref. 24. The collision shift is evaluated with respect to a Langevin collision rate ΓL, defined as the rate of collisions below a critical impact parameter that result in an inward-spiralling trajectory. We calculate the overestimate of the Langevin collision rate using eq. 31 of ref. 24 and with the cutoff velocity given by the 50% threshold of the Ramsey suppression factor as defined in section 2 of ref. 24. Using ω ≈ 1 MHz for Lu-1 and ω ≈ 500 kHz for Lu-2 yields ΓL = 1.3 × 10⁻³ s−1 and 2.1 × 10⁻³ s−1 for the respective Langevin rates, corresponding to 3.5 nPa and 5.8 nPa background pressures of molecular hydrogen at 300 K and consistent with pressure gauge readings. An inverted magnetron gauge on Lu-1 reads 4 nPa, and the ion pumps on both chambers read ‘low pressure’ (<13 nPa) at the limit of the sensitivity of the ion pump controllers. With κ = 1 in eq. 60 of ref. 24, we estimate collision shift bounds of 3.9 × 10⁻²⁰ and 3.2 × 10⁻²⁰ for Lu-1 and Lu-2, respectively.
Blackbody radiation
The differential dynamic polarizability, Δα(ω), for the 848-nm clock transition in 176Lu+ has been well characterized39,40. The BBR shift is given by
where and T0 = 300 K. Over the practical temperature range of 270–330 K, the uncertainty contribution from Δα(ω) is well approximated by \(9.8\times 1{0}^{-20}{\bar{T}}^{4}\) (ref. 40). A detailed temperature assessment is given in the Supplementary Information in which we bound the minimum and maximum temperatures to [299.8, 303.2] K for Lu-1 and [299.6, 301.9] K for Lu-2.
Trap secular frequencies
The Lu-1 trap used in previous work16 had an unusually high heating rate, which has been resolved after replacing the ion trap with one of the same design53. Moreover, the helical resonators for both Lu-1 and Lu-2 were changed to reduce the RF-drive frequency ΩRF and obtain higher trap confinement without increased RF power. For 0.25 W of RF power at ΩRF = 2π × 9.4 MHz and 11.2 MHz, we obtain secular trapping frequencies of (207, 1,063, 1,134) kHz and (138, 492, 543) kHz for Lu-1 and Lu-2, respectively, in which the weakest confinement corresponds to the axial direction. The combined effect of reduced heating rates and the smaller Lamb–Dicke parameters resulting from the increased radial confinement means ion heating is no longer a significant limitation to the interrogation time. The simulated contrast loss shown in Fig. 2a is evaluated by averaging the final optical pulses over a thermal distribution of radial mode occupation accounting for the heating during the Ramsey time.
Thermal second-order Doppler
Thermal motion gives rise to an SODS given by
where Ti are the average temperatures during the Ramsey interrogation for the axial (i = 1) and radial (i = 2, 3) principal axes, respectively, and kB is Boltzmann’s constant. The geometry factor κ2 = κ3 ≈ 2 accounts for equal contributions from the secular motion and intrinsic micromotion for the two radial principal axes, which is valid when the confinement is predominantly ponderomotive55. Axial confinement is predominantly due to the static potential, and so only secular motion contributes (κ1 ≈ 1).
The initial temperatures and heating rates are determined by measuring the temperature immediately after Doppler cooling and after a fixed delay time. The axial temperature is measured by fitting the thermal dephasing of Rabi flopping on the 804 nm E2 transition. Although the 804 nm laser wave vector is at 45° with respect to the ion trap axis and has a projection onto all principal axes, the radial modes have sufficiently low thermal occupation and a small Lamb–Dicke parameter η that they contribute negligibly to the thermal dephasing. From the weighted mean of three measurements over the course of the campaign, we find the initial temperatures T1,0 = 190.5(5.9) μK for Lu-1 and 189.6(4.7) μK for Lu-2 and heating rates for Lu-1 and 119(17) μK s−1 for Lu-2 (Extended Data Fig. 5). The average temperature during the Ramsey experiment for each mode is given by .
The radial temperatures are measured by spectroscopy on the secular-motion sidebands using the 804 nm E2 transition. The average thermal occupation of one of the radial modes is extracted from the ratio of population transferred on the red and blue sidebands56:
For both traps, the initial measurements on both radial modes are consistent with the temperature 150(30) μK, which is also consistent with the initial axial temperatures to within statistical uncertainty and corresponds to approximately three times the Doppler cooling limit. The sideband ratio method is most sensitive for low , so for measuring the radial heating rates, we first apply Zeeman-degenerate Raman sideband cooling57 to prepare in the motional ground state and then measure the sideband ratio after some delay. Extended Data Fig. 6 shows the results of radial heating measurements in both chambers, which yield heating rates \(\left[\frac{{\rm{d}}{T}_{2}}{{\rm{d}}t},\frac{{\rm{d}}{T}_{3}}{{\rm{d}}t}\right]=[110(15),29.1(2.9)]\,\mathrm{\mu K}\,{{\rm{s}}}^{-1}\) for Lu-1 and [85.5(5.5), 70.4(5.5)] μK s−1 for Lu-2.
Equation (3) is the SODS for a thermal state in the high-temperature limit, , and does not account for the zero-point fluctuations for the quantum ground state for both secular and micromotion58,59, which contribute additional SODS of . This term contributes only a 6% correction to the total SODS for Lu-1 but has been included for completeness.
We estimate the total SODS for a Ramsey time TR as follows:
Excess micromotion
The micromotion shift has two components: an SODS due to oscillatory motion and the a.c. Stark shift due to the RF electric field. Owing to the very low differential polarizability of the clock transition, the a.c. Stark contribution is more than two orders of magnitude smaller than the SODS component and therefore negligible. The micromotion amplitude is evaluated using phase-modulated sideband spectroscopy on the 804-nm E2 clock transition22. The excess micromotion (EMM) SODS is given by
where k804 is the wavenumber of the 804-nm clock transition, and β is the modulation depth. As phase-modulated sideband spectroscopy is sensitive to the phase of the micromotion, we distinguish between two quadrature components β = βm + iβp, where βm is the excess micromotion due to displacement by stray fields, and βp is due to a phase shift between RF electrodes, which we are not able to compensate. Intrinsic micromotion is accounted for separately with the thermal SODS.
Following the procedure described in ref. 22, we measure the modulation depth in three orthogonal directions to evaluate . The results of all measurements of βm,i taken for both ion traps are shown in Extended Data Fig. 4a,b, in which the open circles are measured before compensating for the d.c. stray field and closed circles immediately after. To estimate the EMM shift for each comparison measurement, we linearly interpolate the βm,i measurements, assuming linear growth of the d.c. stray field between measurements. Extended Data Fig. 4c shows the EMM shifts evaluated from the time average of over each comparison interval. We estimate an average relative shift of −1.6(1.3) × 10−20 for Lu-1 and −1.4(0.4) × 10−20 for Lu-2.
As reported in ref. 22, βp is negligibly small for Lu-1. For Lu-2, the three orthogonal components of βp are measured to be [2.22(13), 1.43(12), 1.92(13)] × 10−2, corresponding to an EMM shift of −2.42(19) × 10−19. βp was remeasured at the end of the campaign and found to be in statistical agreement with the original measurement.
a.c. Zeeman, RF
Time-varying magnetic fields give rise to an a.c. Zeeman shift, with the dominant contributions coming from currents in the electrodes driven by the RF-trapping potential. The contribution depends on the component of the RF magnetic field perpendicular to the applied d.c. field60. The clock shift given by
where is the root-mean-square RF magnetic field amplitude perpendicular to the d.c. field and α⊥ = 0.20 mHz μT−2 is the sensitivity coefficient after 3D1 hyperfine averaging60.
Although in previous work B⊥ was measured using an Autler–Townes splitting on the Ba+ clock transition41, here we use an Autler–Townes splitting on the Lu+3D2 |6, 0⟩ to |5, 0⟩ microwave transition. The 3D2F = 5 Landé g-factor, g5 = −0.38575750(19) (ref. 53), is the largest of all 3D1 and 3D2F manifolds, and for ΩRF ≈ 2π × 10 MHz, the linear Zeeman splitting can be brought into resonance with ΩRF at experimentally accessible magnetic fields of B ≲ 2 mT.
The experimental measurement procedure is as follows. Neodymium permanent magnets are used to bias the magnetic field to the required 1.7 mT for Lu-1 and 2.0 mT for Lu-2. Three pairs of coils are used to fine-tune the magnetic field amplitude and optimize the orientation for the state preparation by aligning to a π-polarized 646-nm laser. This ensures the d.c. magnetic field is aligned in the same direction as during the comparison measurements. From , we transfer sequentially to the state using a microwave π pulse and then the state using an 804-nm–848-nm Raman pair. We observe the Autler–Townes splitting by interrogating the to |5, 0⟩ microwave transition with a π pulse for a range of detunings, after which the remaining population is reshelved to by Raman transfer for detection.
Following the treatment in ref. 60, the effective Hamiltonian in the rotating wave approximation describing the microwave interrogation is
where ΩM is the microwave coupling, ΔM is the microwave detuning, \({\varOmega }_{B}=\frac{1}{\hbar }\frac{\sqrt{15}}{2}{g}_{5}{\mu }_{B}{B}_{\perp }\) is the coupling between and |5, ±1⟩ states due to the transverse oscillating magnetic field at frequency ΩRF, and
is the detuning of the RF field from the |5, 0⟩ to |5, ±1⟩ Zeeman splittings, ω±1. Degeneracy of ω±1 is lifted by the differential quadratic Zeeman shift for which Δα ≈ 1.23 kHz mT−2.
Extended Data Fig. 7a shows the simulated spectrum of the Autler–Townes splittings for the operating parameters of Lu-1 and ΩB =2π × 3 kHz. For both Lu-1 and Lu-2, several spectra were taken at a fixed magnetic field in the vicinity of the Autler–Townes splitting, of which three from Lu-1 are shown in Extended Data Fig. 7b–d. We fit the measured data to simulated spectra to obtain ΩB. Taking the mean of the ΩB fit values, with the standard deviation of fit values as the uncertainty, we find to be 0.220(5) μT and 0.303(4) μT for Lu-1 and Lu-2, respectively. The RF-drive voltage to the trap is monitored over the campaign and for both Lu-1 and Lu-2 varied by less than 0.5%.
a.c. Zeeman, microwave
When applying the microwave fields during the Ramsey sequence for hyperfine averaging, there is a probe-induced shift because of the σ± polarization components off-resonantly coupling to m = ±1 Zeeman states. Evaluation of this shift is discussed in detail in the supplementary material of ref. 16. The total microwave a.c. Zeeman shift is given by
where Δk,F is the shift of |F, m = 0⟩ when microwave coupling Ωk is on. The microwave field polarizations are characterized by measuring the π times τkq for the field k and polarization q, at fixed microwave power, from which the shifts Δk,F are evaluated as
where ωF > 0 is the Zeeman splitting for the hyperfine level F.
This shift is suppressed by ensuring τk ≪ TR, balancing the circular polarization components (τk+ ≈ τk−), and maximizing the π coupling (τk0 ≪ τk±). All microwave horns are mounted on rotation mounts and are tuned, through a combination of translation and rotation, to the condition τk+ ≈ τk− as much as possible at the start of the campaign. All τkq were characterized at three points in the campaign, and the evaluated clock shifts were consistently below 1 × 10⁻²⁰.
Quadrupole shift
The hyperfine-averaged residual quadrupole moment has been reported as \(\widetilde{\varTheta }=-2.54(0.25)\times 1{0}^{-4}\,e{a}_{0}^{2}\) (ref. 42), which has been independently confirmed by an alternate method23. The residual quadrupole shift, , is evaluated by measuring the quadrupole shift, δνQ,1, on the 3D1 |7, 0⟩ to |8, 0⟩ microwave clock transition, which are related by
where \(\varTheta {(}^{3}{D}_{1})=0.63862(74)\,e{a}_{0}^{2}\) (ref. 61). We measure the microwave transition frequencies for both traps by microwave Ramsey spectroscopy with a 10 s interrogation time. The quadrupole shifts δνQ,1 are inferred using the unperturbed microwave frequencies23 and accounting for the second-order Zeeman shifts. The residual quadrupole shifts on Lu-1 and Lu-2 are evaluated to be 3.3(3) × 10−20 and 1.35(14) × 10−19, respectively. Given the accuracy of the measured unperturbed microwave frequencies23, the quadrupole shift may be easily suppressed further by setting the magnetic field angle so as to null the microwave quadrupole shifts as much as is required.
Microwave coupling errors
Incorrect microwave pulse areas due to uncertainty in the respective couplings give rise to timing errors in HA–HR spectroscopy. As derived in the supplementary material of ref. 16, the shifts due to microwave coupling errors are bound by
where Δk is the microwave detuning, τk is the microwave π pulse duration, and qk is the fractional error in the microwave coupling for the k = 1, 2 microwave transitions.
These shifts are suppressed for Ramsey times TR ≫ τL, τk, as is the case for the comparison experiments reported here. The magnetic field was actively steered to a fixed value in both chambers so the microwave detunings Δk are stable and known precisely from the quadrupole shift assessment. The microwave couplings were measured at the beginning, middle and end of the campaign with about 0.2% measurement precision and found to deviate by less than 0.5%, with the exception of Ω2 on Lu-2, which drifted by 1.5% from the beginning to the end of the campaign. Extended Data Fig. 8, for example, shows this shift evaluated for the worst case of q2 = 0.015 as a function of the detuning Δ2. Although the Δk are precisely known at the <10 mHz level, which, in principle, allows for a more accurate estimation of this shift, we take a conservative approach and use the full width of the bounding envelope, given by the second term in equation (11), as the uncertainty.
a.c. Stark
For an optical π time of \({\tau }_{{\rm{L}}}=\frac{{\rm{\pi }}}{{\varOmega }_{{\rm{L}}}}=4\,\mathrm{ms}\), the a.c. Stark shift on the |g⟩ to |8⟩ optical transition when interrogating with the 848-nm laser is approximately ΔS = 2π × 25 Hz. In the absence of additional effects, both the HR37 sequence, Extended Data Fig. 9a, which was used in previous work16, and the time-reversed HR sequence, Extended Data Fig. 9b, which is used in this work, equivalently suppress the resulting clock shift to \(\frac{2}{{\rm{\pi }}{T}_{{\rm{R}}}}{\left(\frac{\varDelta }{{\varOmega }_{{\rm{L}}}}\right)}^{3}\), in Hz, where Δ = ΔSP − ΔS is the error in the frequency step, ΔSP, applied during the optical interrogation pulses. To set the laser frequency step, ΔSP, the a.c. Stark shift was measured to better than 1% for both Lu-1 and Lu-2 at the start of the campaign by interleaved self-comparison of Rabi and HR spectroscopy. The value of the ΔSP was fixed throughout the campaign, and we bound the uncertainty in Δ to 2% of |ΔS| for Lu-1 and 5% of |ΔS| for Lu-2 based on the maximum observed variation in the optical couplings, which were measured at the beginning, middle and end of the campaign with measurement precision of about 0.2%.
When including the effects of ion heating, HR schemes present a weak linear dependence on Δ (ref. 62). This linear dependence is evaluated by simulation with the results for the typical operating parameters of Lu-2 shown in Extended Data Fig. 9c. It is noted that the linear slope has the opposite sign for HR and HR reverse schemes, and that a hybrid error signal constructed by averaging the two schemes cancels the thermal effect, restoring the cubic dependence on Δ. The idea of combining sequences to generate a more robust error signal is similar to modified HR63 and generalized HR64, but unlike those schemes for which ion heating results in either an offset or increased sensitivity compared with the basic HR scheme62, this simple hybrid combination of HR and HR reverse heavily suppresses the linear dependence on ion heating, at least in the regime τL ≪ TR, in which heating during the optical pulse is negligible compared with during the dark time TR.
For the experiments reported here, the shift was already sufficiently small that only HR reverse was used. From the measured radial heating rates, uncertainty in Δ and the linear dependence determined from simulation, we estimate a total uncertainty from the a.c. Stark effect to be 3.8 × 10⁻²¹ for Lu-1 and 2.5 × 10⁻²⁰ for Lu-2 for TR = 5 s.
a.c. Quadrupole, RF
The oscillating RF quadrupole field couples off-resonantly to hyperfine transitions giving rise to an a.c. quadrupole shift that is not cancelled by hyperfine averaging65. We estimate this shift by assuming an ideal linear Paul trap with RF potential of the form Φ(x, y, z) = ϵ(x2 − y2) in the principal-axis frame, where the electric field gradient \({\epsilon }=\frac{m{\varOmega }_{\mathrm{RF}}{\omega }_{{\rm{r}}}}{e\sqrt{2}}\) is determined by the radial pseudo-potential confinement frequency ωr ≈ 2π × 1,100 kHz for Lu-1 and 510 kHz for Lu-2. The magnetic field in both chambers is aligned to approximately 33(3)° with respect to the ion trap axis (z). Under these conditions, we evaluate65 a relative clock shift of the HA frequency of −2.0 × 10⁻²¹ for Lu-1 and −5.7 × 10⁻²² for Lu-2.
As shown schematically in Fig. 1a, the differential path length is actively stabilized with reference to retroreflecting mirrors below the respective experimental chambers that are near the table surface and approximately 20 cm below the trapped ions. The differential phase stability is characterized by out-of-loop measurement of the optical phase with the clock beams directed to a common beam splitter instead of the ions, requiring approximately 2 m of additional unstabilized optical path length. When simultaneously switching on AOMs 1a and 2a, as for the Ramsey pulses in the comparison interrogation sequence, a differential phase chirp is induced by the lock circuitry as shown in Extended Data Fig. 10a. This is well modelled by a damped harmonic oscillation with the fit parameters shown in Extended Data Fig. 10a. By straightforward extension of the analysis given in ref. 66, we evaluate a −4.8(8) × 10−21 systematic shift to the difference frequency between Lu-1 and Lu-2 for TR = 5 s.
We consider two sources of first-order Doppler shift (FODS): drift of the ion with respect to the trap along the clock probe (vertical) direction and differential drifts of the optical phase.
The measured micromotion modulation depth βm,3 can be directly related to the displacement of the ion from the trap RF null along the clock interrogation direction22. For small modulation depth, the relationship is linear with scale factors of approximately 0.77 μm/βm,3 for Lu-1 and 2.0 μm/βm,3 for Lu-2. Extended Data Fig. 4d shows the evaluated FODS shift for each comparison measurement, where the average velocity is estimated from the inferred displacement between the EMM measurements. The weighted FODS for the entire campaign is estimated to be 2.4(3.5) × 10−23 for Lu-1, −0.3(2.0) × 10−22 for Lu-2 and 0.5(2.0) × 10−22 for the difference.
Using the same measurement setup as for AOM chirp, we measure the out-of-loop differential phase for long durations for which we observed an instability asymptote of 3.0 × 10⁻¹⁶ (τ/s)−1 as shown in Extended Data Fig. 10b (blue). For typical servo operation at 87% interrogation duty cycle, we evaluate a contribution of 2.0 × 10⁻¹⁷ (τ/s)−1/2 (orange). This is well below the comparison instability on all timescales. When operating as a single clock, the path length is actively stabilized from the laser to reference mirror instead of differentially between chambers, but can be expected to contribute at the same level or lower because of the shorter unstabilized path.
The RF synthesizers used for the AOMs are based on the AD9912 chip and have approximately 7 μHz resolution. This contributes about 1 × 10⁻²⁰ fractional uncertainty, half of the minimum step size, to the comparison servo. The synthesized microwave frequencies, f1 and f2, were identical and generated from the same sources for Lu-1 and Lu-2, set to the nearest 1 mHz. All synthesizers are referenced to a common hydrogen maser, which is calibrated to ≲2 × 10⁻¹⁵ at the start of the measurement campaign67. For the comparison measurement, any error in maser accuracy is common mode and contributes no uncertainty to the difference.
However, we note that when realizing a Lu+ standard using HA–HR spectroscopy as , the accuracy of the synthesized microwaves fk is also not a limitation to optical clock accuracy because the servo action steers the laser to compensate any errors in the microwave fields such that this specific linear combination of the fields is the HA frequency. The HA–HR servo is sensitive to the instability of both the laser and microwave fields at the same level, in Hz. In practice, this places a more relaxed requirement on the microwaves as compared with the laser; for example, for a laser with fractional instability , the microwaves need only a fractional stability better than \(\frac{\delta {f}_{k}}{{f}_{k}}\lesssim \frac{\delta {f}_{{\rm{L}}}}{{f}_{k}} \sim 1{0}^{-12}\) to not limit the clock instability.
Gravitational redshift
The differential redshift between the ions is given by , where g ≈ 9.776 m s−2 is the local gravitational acceleration and δh = h1 − h2 is the height difference of the ions. We measure the heights of the ions relative to a laser levelling assembly fixed to the optical table, which is precisely aligned to each ion by the same imaging optics used for state detection. We determine the ion heights h1 = 7.44(10) mm and h2 = 11.41(10) mm. Measurements of the table levelling by a precision spirit level with 0.02 mm m−1 resolution are limited by the table surface flatness but bound the table tilt to <0.2 mm m−1. The ion traps are separated by 1.2 m, and table levelling contributes the dominant uncertainty of 240 μm. The height difference of the ions is evaluated to be δh = −3.97(27) mm, corresponding to a −4.31(29) × 10−19 differential shift.
Clock stability
The stability of a single-ion optical clock is quantum-projection-noise limited at the longest achievable interrogation time, which is set by either the optical coherence of the local oscillator or the atomic coherence, whichever is shorter. State-of-the-art cavity-stabilized lasers reach fractional instabilities in the low 10−17 at 1 s (refs. 28,33) and have enabled demonstrated single-ion clock instabilities as low as 3.5 × 10⁻¹⁶ (τ/s)−1/2 (ref. 12). Although our laboratory lacks a local oscillator of this quality with which to challenge ion clock stability at this level directly, our comparison does probe the limits set by atomic coherence, allowing us to infer the technical limits to interrogation time independent of any clock laser. Comparison of two references by correlation spectroscopy carries a factor of √2 higher instability than a comparison of independent clocks, and a factor of 2 higher than a single standalone clock, for equal interrogation time. Insofar as the present comparison is limited by uncorrelated magnetic field noise, these systems, when combined with state-of-the-art laser stabilization, would support a single-clock instability of about 2.4 × 10⁻¹⁶ (τ/s)−1/2. Because the 3D1 lifetime imposes no practical limit, substantially longer interrogation times remain possible, contingent on overcoming magnetic field noise, ion trap heating and background gas collisions. Reducing the d.c. magnetic field lowers the linear sensitivity to field noise at the cost of smaller Zeeman splittings; nevertheless, operation at 25 μT is achievable with modest changes to our laser configuration. By our assessment, this would permit interrogation times up to 30 s in the present system. Even longer coherence times can be anticipated with the use of magnetic shielding and cryogenics, albeit at the cost of increased experimental complexity.
Data availability
Source data are provided with this paper. Any additional data are available from the corresponding authors upon request.
Code availability
All codes to analyse the data in this study are available from the corresponding authors upon request.
Ludlow, A. D., Boyd, M. M., Ye, J., Peik, E. & Schmidt, P. O. Optical atomic clocks. Rev. Mod. Phys. 87, 637 (2015).
Dimarcq, N. et al. Roadmap towards the redefinition of the second. Metrologia 61, 012001 (2024).
Lion, G. et al. Determination of a high spatial resolution geopotential model using atomic clock comparisons. J. Geod. 91, 597–611 (2017).
Mehlstäubler, T. E., Grosche, G., Lisdat, C., Schmidt, P. O. & Denker, H. Atomic clocks for geodesy. R. Prog. Phys. 81, 064401 (2018).
Safronova, M. et al. Search for new physics with atoms and molecules. Rev. Mod. Phys. 90, 025008 (2018).
Sanner, C. et al. Optical clock comparison for Lorentz symmetry testing. Nature 567, 204–208 (2019).
Takamoto, M. et al. Test of general relativity by a pair of transportable optical lattice clocks. Nat. Photon. 14, 411–415 (2020).
Kennedy, C. J. et al. Precision metrology meets cosmology: improved constraints on ultralight dark matter from atom-cavity frequency comparisons. Phys. Rev. Lett. 125, 201302 (2020).
Filzinger, M. et al. Improved limits on the coupling of ultralight bosonic dark matter to photons from optical atomic clock comparisons. Phys. Rev. Lett. 130, 253001 (2023).
Godun, R. M. et al. Frequency ratio of two optical clock transitions in 171Yb+ and constraints on the time variation of fundamental constants. Phys. Rev. Lett. 113, 210801 (2014).
Huntemann, N. et al. Improved limit on a temporal variation of mp/me from comparisons of Yb+ and Cs atomic clocks. Phys. Rev. Lett. 113, 210802 (2014).
Marshall, M. C. et al. High-stability single-ion clock with 5.5 × 10⁻¹⁹ systematic uncertainty. Phys. Rev. Lett. 135, 033201 (2025).
Aeppli, A., Kim, K., Warfield, W., Safronova, M. S. & Ye, J. Clock with 8 × 10⁻¹⁹ systematic uncertainty. Phys. Rev. Lett. 133, 023401 (2024).
Zhang, B.-I. et al. Liquid-nitrogen-cooled 40Ca+ ion optical clock with a systematic uncertainty of 4.4 × 10⁻¹⁹. Phys. Rev. Lett. 136, 053202 (2026).
McGrew, W. F. et al. Atomic clock performance enabling geodesy below the centimetre level. Nature 564, 87–90 (2018).
Zhiqiang, Z., Arnold, K. J., Kaewuam, R. & Barrett, M. D. 176Lu+ clock comparison at the 10−18 level via correlation spectroscopy. Sci. Adv. 9, eadg1971 (2023).
Boulder Atomic Clock Optical Network (BACON) Collaboration. Frequency ratio measurements at 18-digit accuracy using an optical clock network. Nature 591, 564–569 (2021).
Boulder Atomic Clock Optical Network (BACON) Collaboration. Atomic clock frequency ratios with fractional uncertainty ≤3.2 × 10⁻¹⁸. Phys. Rev. Lett. 137, 033201 (2026).
Dörscher, S. et al. Optical frequency ratio of a 171Yb+ single-ion clock and a 87Sr lattice clock. Metrologia 58, 015005 (2021).
Pizzocaro, M. et al. International optical clock comparison using the European optical fiber network. Phys. Rev. Res. 8, 033250 (2026).
Arnold, K. J. et al. Validating a lutetium frequency reference. J. Phys. Conf. Ser. 2889, 012040 (2024).
Arnold, K. J. et al. Enhanced micromotion compensation using a phase-modulated light field. Phys. Rev. A 110, 033115 (2024).
Lee, M. D. K. et al. Precision measurement of the 176Lu+3D1 microwave clock transitions. Phys. Rev. A 113, 012805 (2026).
Barrett, M. D. & Arnold, K. J. Analysis of collision-shift assessments in ion-based clocks. Phys. Rev. A 114, 013104 (2026).
Kim, K. et al. Atomic coherence of 2 minutes and instability of 1.5 × 10⁻¹⁸ at 1 s in a Wannier-Stark lattice clock. Phys. Rev. Lett. 135, 103601 (2025).
Hinkley, N. et al. An atomic clock with 10−18 instability. Science 341, 1215–1218 (2013).
Liu, X.-Y. et al. Zero-dead-time strontium lattice clock with a stability at 10−19 level. Phys. Rev. Lett. 135, 263402 (2025).
Oelker, E. et al. Demonstration of 4.8 × 10⁻¹⁷ stability at 1 s for two independent optical clocks. Nat. Photon. 13, 714–719 (2019).
Chwalla, M. et al. Precision spectroscopy with two correlated atoms. Appl. Phys. B 89, 483–488 (2007).
Chou, C. W., Hume, D. B., Thorpe, M. J., Wineland, D. J. & Rosenband, T. Quantum coherence between two atoms beyond Q = 1015. Phys. Rev. Lett. 106, 160801 (2011).
Clements, E. R. et al. Lifetime-limited interrogation of two independent 27Al+ clocks using correlation spectroscopy. Phys. Rev. Lett. 125, 243602 (2020).
Kim, M. E. et al. Improved interspecies optical clock comparisons through differential spectroscopy. Nat. Phys. 19, 25–29 (2023).
Lee, D. et al. Frequency stability of 2.5 × 10⁻¹⁷ from a Si cavity with AlGaAs crystalline mirrors. Phys. Rev. Lett. 136, 033801 (2026).
Bernard, J. E., Marmet, L. M. & Madej, A. A. A laser frequency lock referenced to a single trapped ion. Opt. Commun. 150, 170–174 (1998).
Barrett, M. D. Developing a field independent frequency reference. New J.Phys. 17, 053024 (2015).
Kaewuam, R. et al. Hyperfine averaging by dynamic decoupling in a multi-ion lutetium clock. Phys. Rev. Lett. 124, 083202 (2020).
Yudin, V. I. et al. Hyper-Ramsey spectroscopy of optical clock transitions. Phys. Rev. A 82, 011804 (2010).
Huntemann, N. et al. Generalized Ramsey excitation scheme with suppressed light shift. Phys. Rev. Lett. 109, 213002 (2012).
Arnold, K. J., Kaewuam, R., Roy, A., Tan, T. R. & Barrett, M. D. Blackbody radiation shift assessment for a lutetium ion clock. Nat. Commun. 9, 1650 (2018).
Arnold, K. J. et al. Dynamic polarizability measurements with 176Lu+. Phys. Rev. A 99, 012510 (2019).
Arnold, K. J. et al. Precision measurements of the 138Ba+ 6s2S1/2 – 5d2D5/2 clock transition. Phys. Rev. Lett. 124, 193001 (2020).
Zhiqiang, Z., Arnold, K. J., Kaewuam, R., Safronova, M. S. & Barrett, M. D. Hyperfine-mediated effects in a Lu+ optical clock. Phys. Rev. A 102, 052834 (2020).
Hankin, A. M. et al. Systematic uncertainty due to background-gas collisions in trapped-ion optical clocks. Phys. Rev. A 100, 033419 (2019).
Vutha, A. C., Kirchner, T. & Dubé, P. Collisional frequency shift of a trapped-ion optical clock. Phys. Rev. A 96, 022704 (2017).
Fortier, T. M., Luiten, A. N. & Margolis, H. S. Optical atomic clocks: defining the future of time and frequency metrology. Optica 13, 143–163 (2026).
Grotti, J. et al. Geodesy and metrology with a transportable optical clock. Nat. Phys. 14, 437–441 (2018).
Barrett, M. D. & Arnold, K. J. An extrapolation method for polarisability assessments of ion-based optical clocks. New J. Phys. 27, 013005 (2025).
Denker, H. et al. Geodetic methods to determine the relativistic redshift at the level of 10−18 in the context of international timescales: a review and practical results. J. Geod. 92, 487–516 (2018).
Brewer, S. M. et al. 27Al+ quantum-logic clock with a systematic uncertainty below 10−18. Phys. Rev. Lett. 123, 033201 (2019).
Bothwell, T. et al. JILA SrI optical lattice clock with uncertainty of 2.0 × 10⁻¹⁸. Metrologia 56, 065004 (2019).
Lindvall, T. et al. 88Sr+ optical clock with 7.9 × 10⁻¹⁹ systematic uncertainty and measurement of its absolute frequency with 9.8 × 10⁻¹⁷ uncertainty. Phys. Rev. Appl. 24, 044082 (2025).
Jia, Z.-P. et al. Improved systematic evaluation of a strontium optical clock with uncertainty below 1×10⁻¹⁸. Metrologia 63, 025002 (2026).
Zhao, Q. et al. Landé g-factor measurements for the 5d6s 3D2 hyperfine levels of 176Lu+. Phys. Rev. A 112, 032808 (2025).
Myerson, A. H. et al. High-fidelity readout of trapped-ion qubits. Phys. Rev. Lett. 100, 200502 (2008).
Berkeland, D. J., Miller, J. D., Bergquist, J. C., Itano, W. M. & Wineland, D. J. Minimization of ion micromotion in a Paul trap. J. Appl. Phys. 83, 5025–5033 (1998).
Turchette, Q. A. et al. Heating of trapped ions from the quantum ground state. Phys. Rev. A 61, 063418 (2000).
Qichen, Q. et al. Zeeman degenerate sideband cooling in 176Lu+. Phys. Rev. A 113, 013109 (2026).
Martínez-Lahuerta, V. J., Eilers, S., Mehlstäubler, T. E., Schmidt, P. O. & Hammerer, K. Ab initio quantum theory of mass defect and time dilation in trapped-ion optical clocks. Phys. Rev. A 106, 032803 (2022).
Sorci, G., Foo, J., Leibfried, D., Sanner, C. & Pikovski, I. Quantum signatures of proper time in optical ion clocks. Phys. Rev. Lett. 136, 163602 (2026).
Gan, H. C. J. et al. Oscillating-magnetic-field effects in high-precision metrology. Phys. Rev. A 98, 032514 (2018).
Kaewuam, R. et al. Precision measurement of the 3D1 and 3D2 quadrupole moments in Lu+. Phys. Rev. A 102, 042819 (2020).
Kuznetsov, S. N. et al. Effect of trapped-ion heating on generalised Ramsey methods for suppressing frequency shifts caused by a probe field in atomic clocks. Quantum Electron. 49, 429 (2019).
Hobson, R. et al. Modified hyper-Ramsey methods for the elimination of probe shifts in optical clocks. Phys. Rev. A 93, 010501 (2016).
Zanon-Willette, T., Lefevre, R., Taichenachev, A. V. & Yudin, V. I. Universal interrogation protocol with zero probe-field-induced frequency shift for quantum clocks and high-accuracy spectroscopy. Phys. Rev. A 96, 023408 (2017).
Arnold, K. J., Kaewuam, R., Tan, T. R. & Barrett, M. D. Oscillating quadrupole effects in high-precision metrology. Phys. Rev. A 99, 022515 (2019).
Falke, S., Misera, M., Sterr, U. & Lisdat, C. Delivering pulsed and phase stable light to atoms of an optical clock. Appl. Phys. B 107, 301–311 (2012).
Zhang, Z. et al. Absolute frequency measurement of a Lu+ (3D1) optical frequency standard via link to international atomic time. Metrologia 62, 035008 (2025).
This project was supported by the National Research Foundation, Singapore, through the National Quantum Office, hosted in A*STAR, under its Quantum Engineering Programme 3.0 Funding Initiative (W25Q3D0007) and under its Centre for Quantum Technologies Funding Initiative (S24Q2d0009).
Author information
These authors contributed equally: K. J. Arnold, M. D. K. Lee
Authors and Affiliations
Centre for Quantum Technologies, National University of Singapore, Singapore, Singapore
K. J. Arnold, M. D. K. Lee, Qi Zhao, Qichen Qin, Zhao Zhang, N. Jayjong & M. D. Barrett
Temasek Laboratories, National University of Singapore, Singapore, Singapore
K. J. Arnold
Department of Physics, National University of Singapore, Singapore, Singapore
M. D. Barrett
K.J.A. and M.D.K.L. performed the experiments and independently analysed the data. K.J.A. prepared the manuscript. M.D.B. supervised the project. K.J.A., M.D.K.L., Q.Z., Q.Q., Z.Z., N.J. and M.D.B. contributed to the design of the experiment, discussion of results and revision of the manuscript.
Corresponding authors
Correspondence to K. J. Arnold or M. D. Barrett.
Ethics declarations
Competing interests
The authors declare no competing interests.
Peer review
Peer review information
Nature thanks the anonymous reviewers for their contribution to the peer review of this work. Peer reviewer reports are available.
Additional information
Publisher’s note Springer Nature remains neutral with regard to jurisdictional claims in published maps and institutional affiliations.
Extended data figures and tables
Extended Data Fig. 1 Measurement of quadratic Zeeman coefficient.
a, measured frequency difference with Lu-1 operated over a range of field amplitudes and Lu-2 at 0.1 mT. The coefficient αz is determined from a quadratic fit (solid line). b, Residuals with respect to the quadratic fit, which have a reduced \({\chi }_{\nu }^{2}=1.6\) for 5 degrees of freedom. c, Three measurements of αz over recent years. The 2023 measurement was reported in16, the 2024 measurement is reported here, and the 2025 measurement is from the data shown in a,b. The vertical line and shaded area represent the combined value of αz = −4.893 27(51) Hz/mT2.
Extended Data Fig. 2 Magnetic field instability.
(blue) measurement of shorter time scale field instability without magnetic field compensation, (orange) instability inferred with magnetic field compensation from in-loop ∣3 Zeeman splitting measurements, and (green) independent measurement of magnetic field instability with magnetic field compensation but inferred from out-of-loop ∣3 Zeeman splitting measurements.
Extended Data Fig. 3
a Detection sequence: (orange) di are standard Bayesian state detection and bi high threshold fixed time detection, (red) 848 nm clock pulses of variable area for shelving, (blue) repump (350 nm, 622 nm, and 895 nm) pulse, and (light orange) laser cooling. b Probability of occurrence for outcome (i), first detected bright at d4, and outcome (ii), first detected bright on bi, as a function of Ramsey time for Lu-1 (blue points) and Lu-2 (orange points). Solid lines are linear fits to determine rates.
Extended Data Fig. 4
a,b, EMM modulation depths βm,i measured in three orthogonal directions. Solid circles are measurements before compensation, and open circles are measured immediately after compensation. Solid lines are an interpolation over measurement durations. c Total EMM shift evaluated for each comparison measurement interval. d First-order Doppler shift (FODS) evaluated for the ion displacements along the probe direction inferred from βm,3 measurements.
Extended Data Fig. 5
a,b, A typical measurement of the axial temperature by thermal dephasing after Doppler cooling (t = 0) and after a 1 second delay. c,d Initial axial temperatures and heating rates from three measurements over the course of the campaign for Lu-1 and Lu-2.
Extended Data Fig. 6
Radial heating rates for Lu-1 (a,c) and Lu-2 (b,d) measured by sideband ratio thermometry after ground state cooling. a,b are representative heating rate measurements for both radial modes in each trap. c,d Heating rates obtained from all repeat measurements. Solid circles (index 1) were taken at the time of the measurement campaign; and open circles one year later with the same trap operating parameters, with measurements at indices 2 and 3 separated by approximately one week. Solid lines and shaded areas represent the radial heating rates and uncertainties used for SODS shift evaluation. For a radial mode measured during the campaign, the campaign value is used; for the remaining modes, the weighted mean of the later measurements is used. In all cases the uncertainty is taken as the largest among the individual measurements of that mode.
Extended Data Fig. 7
a Simulated Autler-Townes splitting for ΩM = 2π × 100 Hz and ΩB = 2π × 3 kHz in Lu-1. Solid black lines denote the Autler-Townes resonance conditions Δ±1 = 0. Dashed lines indicate the magnetic fields corresponding to experiment scans b-d. b-d Simulation results (orange lines) of Hamiltonian Eq. (7) which are fit to experimental data (blue points) with ΩB as a free parameter.
Extended Data Fig. 8 Fractional frequency shift for HA-HR due to microwave coupling errors.
Evaluated with T = 5 s, τL = 8 ms, and τ1 = τ2 = 12 ms as function of microwave detuning Δ2 for both no coupling error (q2 = 0, blue) and 1.5% error (q2 = 0.015, orange). Points are exact numerical simulation, solid lines are evaluated by the analytic approximation given in the Supplementary Material of16 and dashed lines are the bounding envelope for the uncertainty given by Eq. (11).
Extended Data Fig. 9
a,b Hyper-Ramsey and Hyper-Ramsey reverse pulse sequences. c Simulation of Hyper-Ramsey suppression when including thermal effects for both sequences for the typical operating parameters of Lu-2. By averaging the two sequences, one recovers the cubic sensitivity of Hyper-Ramsey independent of the final thermal state.
Extended Data Fig. 10
a Measured differential phase chirp when switching the AOMs for optical pulses. The phase chirp is modeled as a damped harmonic oscillation with fit parameters given in the plot. b Blue points are instability from differential optical phase fluctuations measured out-of-loop with an additional 2 m of unstabilized path while the path length stabilization is engaged. Orange is the estimated contribution during comparison measurements due to sampling at 87% duty cycle.
Supplementary information
Supplementary Information (download PDF )
This file contains Supplementary Text, Supplementary Figs. 1–3, Supplementary Tables 1 and 2, and Supplementary References.
Source data
Rights and permissions
Open Access This article is licensed under a Creative Commons Attribution-NonCommercial-NoDerivatives 4.0 International License, which permits any non-commercial use, sharing, distribution and reproduction in any medium or format, as long as you give appropriate credit to the original author(s) and the source, provide a link to the Creative Commons licence, and indicate if you modified the licensed material. You do not have permission under this licence to share adapted material derived from this article or parts of it. The images or other third party material in this article are included in the article’s Creative Commons licence, unless indicated otherwise in a credit line to the material. If material is not included in the article’s Creative Commons licence and your intended use is not permitted by statutory regulation or exceeds the permitted use, you will need to obtain permission directly from the copyright holder. To view a copy of this licence, visit http://creativecommons.org/licenses/by-nc-nd/4.0/.
About this article
Cite this article
Arnold, K.J., Lee, M.D.K., Zhao, Q. et al. Lu+ optical frequency references with accuracy verified at the 19th digit. Nature (2026). https://doi.org/10.1038/s41586-026-11072-8
Version of record
DOIhttps://doi.org/10.1038/s41586-026-11072-8
Share this article
Anyone you share the following link with will be able to read this content:
Sorry, a shareable link is not currently available for this article.
Provided by the Springer Nature SharedIt content-sharing initiative